Tag: Government spending
-

Local government employment in Kansas
Kansas has nearly the highest number of local government employees per resident, compared to other states.
-

Kansas government employment and payroll by function
Looking at the number of state government employees in proportion to population, Kansas has many compared to other states.
-

Deficit shrank in August, but …
The top takeaway of the Congressional Budget Office Monthly Budget Review for August 2020 is that the deficit for the month is smaller than last August. But there are details.
-

Kansas general fund spending and receipts
The Kansas budget is volatile, with rising spending and a large deficit.
-

Border wall procedures criticized
A government watchdog says the procedures for acquiring the southern border wall are inadequate, and the ability to maintain complete operational control is diminished.
-

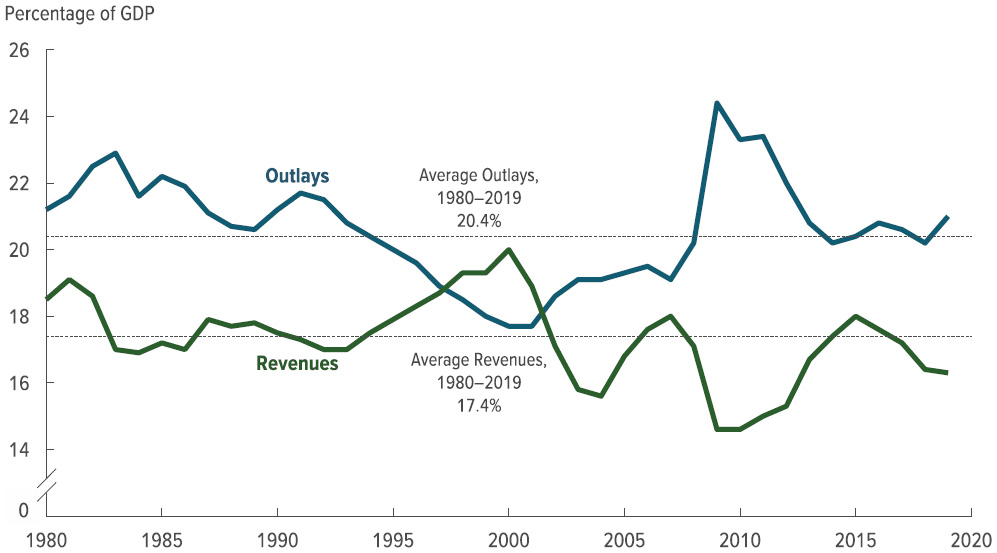
Federal revenue and outlays
An interactive visualization of federal government revenue and spending from 1962 to the present.
-

Wichita needs transparency from its agencies
When the Wichita city council delegates spending to outside agencies such as Visit Wichita, it should insist on the same transparency requirements the city itself faces.
-

Private investment declines
While government spending rises, private domestic investment declines.
-

Wichita public schools, by the charts
Data from the annual report for the 2018-2019 school year for USD 259, the Wichita, Kansas public school district.
-

Financial state of the cities
Wichitans carry a “Taxpayer Burden” of $1,200 per taxpayer, which is not as bad as many cities.
-
Federal budget summary for 2019
Federal revenues for 2019 were up, but spending increased by a larger amount, resulting in a higher deficit.
-

State and local government employees and payroll
Looking at the number of government employees in proportion to population, Kansas has many compared to other states, and especially so in education.