Tag: Kansas State Department of Education
-
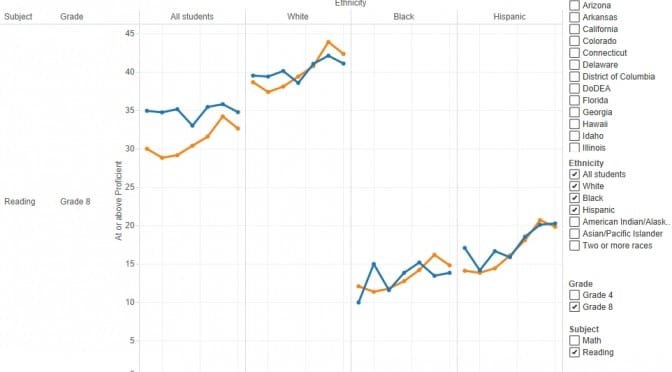
Kansas NAEP scores for 2015
Reactions to the release of National Assessment of Educational Progress scores for Kansas and the nation. Also, an interactive visualization.
-
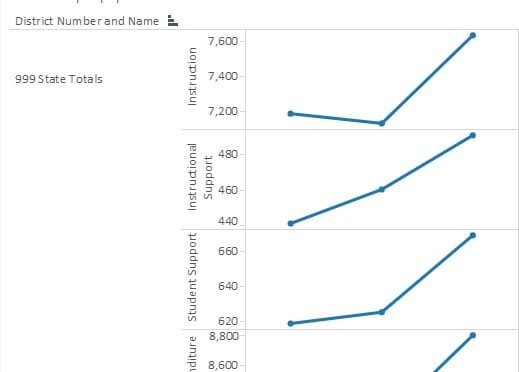
Kansas school support
An interactive visualization of data provided to members of the Kansas 2015 Special Committee on K-12 Student Success.
-

What are opinions of the level of Kansas school spending?
Part of the difficulty in understanding and debating school spending in Kansas is the starting point, that is, the lack of factual information. From 2012, a look at a survey that revealed the level of knowledge of school spending by Kansans.
-
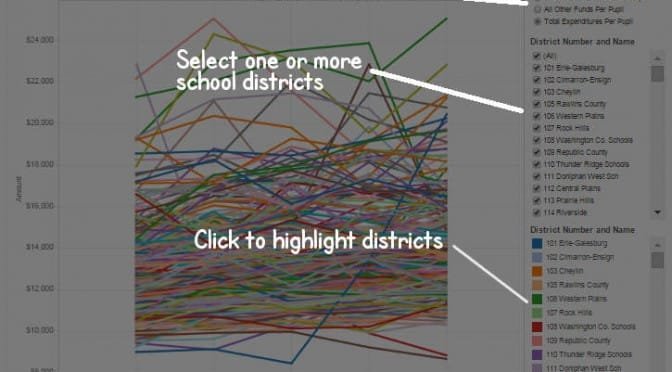
Kansas school expenditures per pupil
The Kansas State Department of Education publishes a series of worksheets titled Expenditures Per Pupil. Here is the data gathered and presented in an interactive visualization.
-

Kansas school fund balances
Kansas school fund balances rose slightly this year, both in absolute dollars and dollars per pupil.
-
Kansas Center for Economic Growth and the truth
Why can’t Kansas public school spending advocates — especially a former Kansas state budget director — tell the truth about schools and spending, wonders Dave Trabert of Kansas Policy Institute.
-

Kansas schools shortchanged by accounting systems
Kansas schools could receive $21 million annually in federal funds if the state had adequate information systems in place.
-
Kansas school standards found lower than in most states
A second study finds that Kansas uses low standards for evaluating the performance of students in its public schools.
-

Kansas school funding growing faster than inflation
Kansas school funding has been growing much faster inflation and enrollment, but for some, it will never be enough, and they will continue to use taxpayer money to press their monetary demands, writes Dave Trabert of Kansas Policy Institute.
-
WichitaLiberty.TV: Bad news from Topeka on taxes and schools, and also in Wichita. Also, a series of videos that reveal the nature of government.
In this episode of WichitaLiberty.TV: The sales tax increase is harmful and not necessary. Kansas school standards are again found to be weak. The ASR water project is not meeting expectations. Then, the Independent Institute has produced a series of videos that illustrate the nature of government. Episode 88, broadcast July 19, 2015.
-
Kansas school standards evaluated
A new edition of an ongoing study shows that Kansas school standards are weak, compared to other states. This is a continuation of a trend.
-
Examining Kansas City school district claims
A critical look at the statements coming from one of the largest school districts in Kansas leads to wonder if the Kansas City school superintendent is uninformed, misinformed, or simply lying.