Tag: Visualizations
-
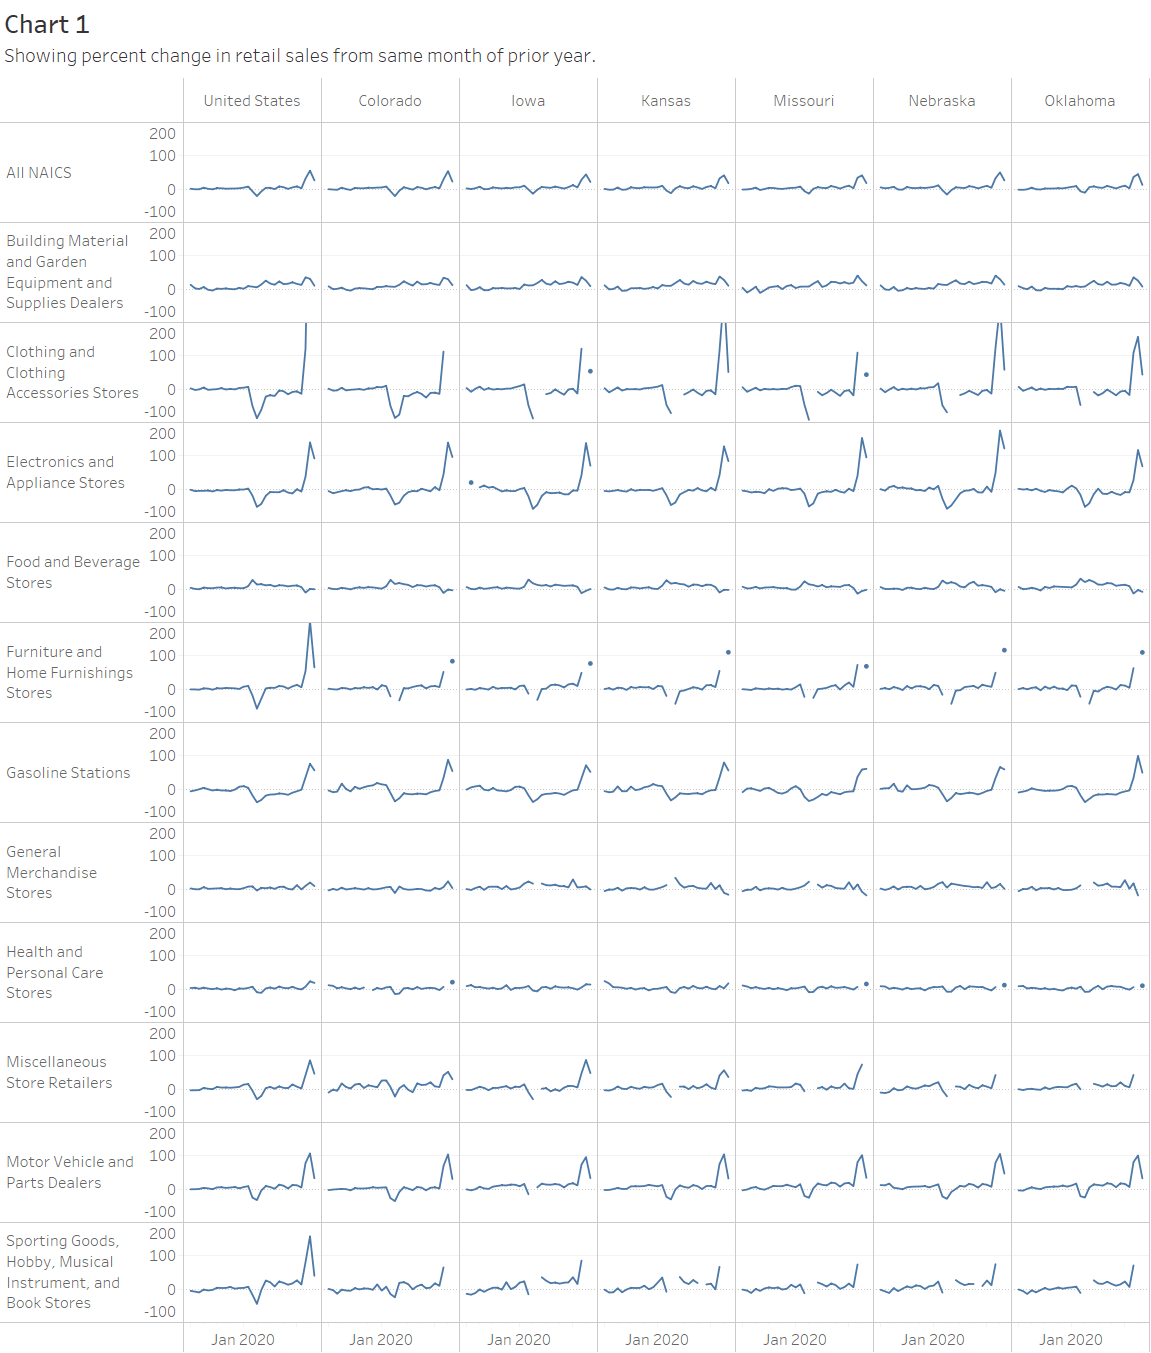
Monthly state retail sales
Monthly retail sales by state and major retail sector, in an interactive visualization.
-
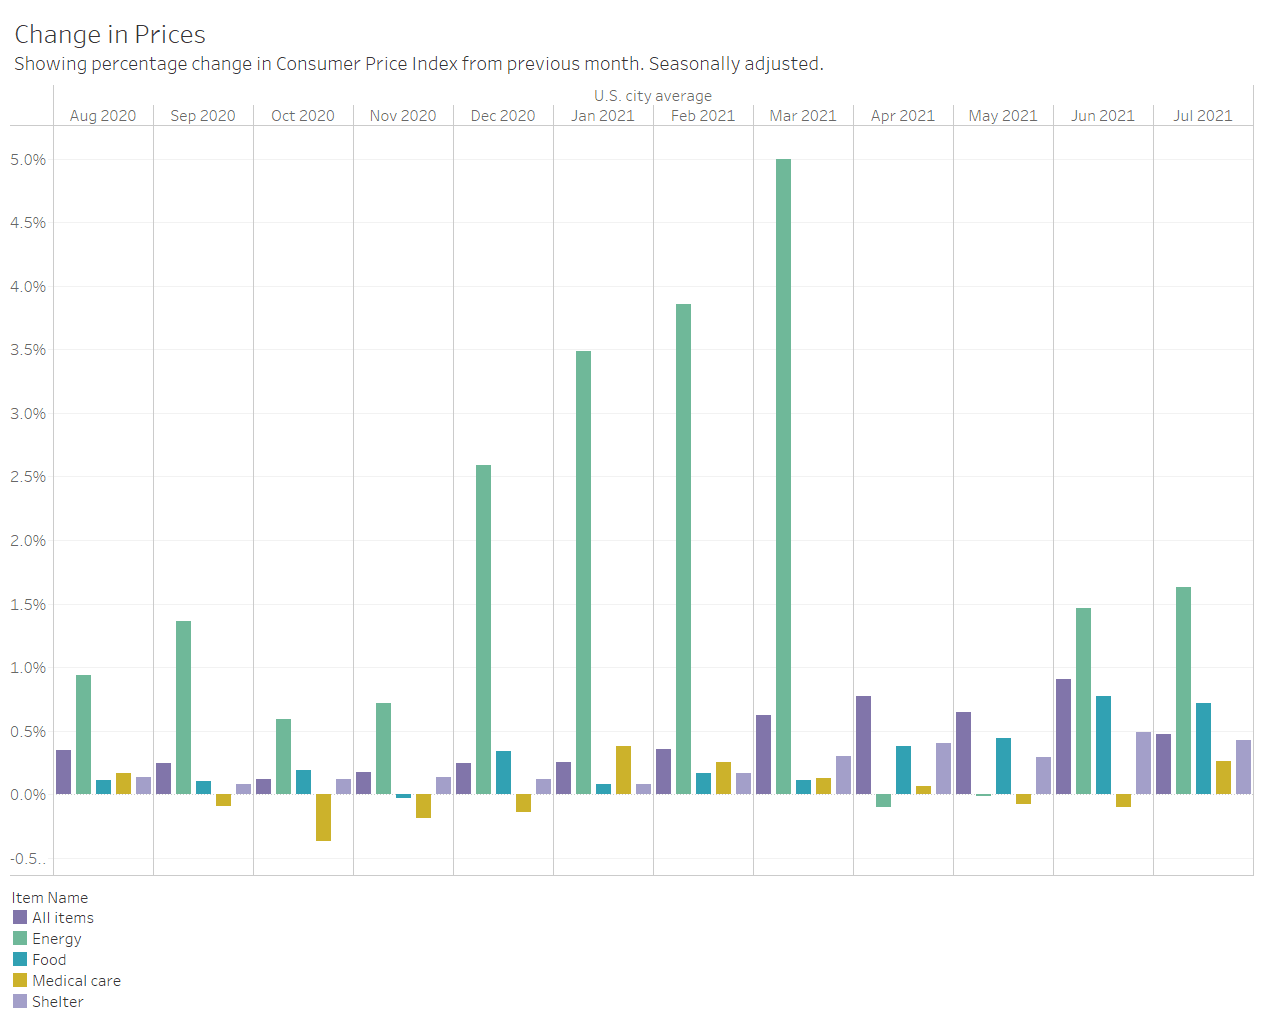
Inflation remains high in July
In July 2021, inflation remains high, although the rate fell from June.
-
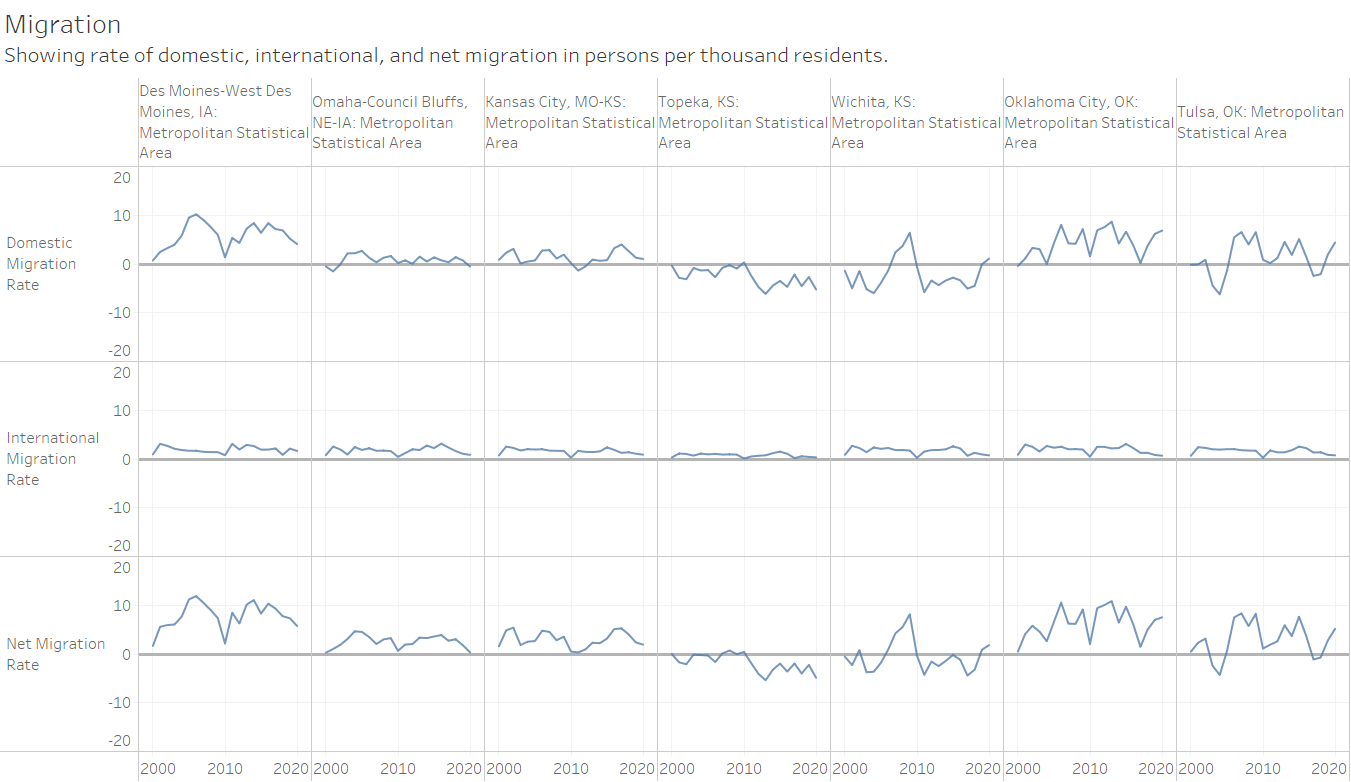
Migration to and from Wichita
The Wichita metropolitan area often suffers from negative domestic migration, but in 2020 domestic migration was positive.
-
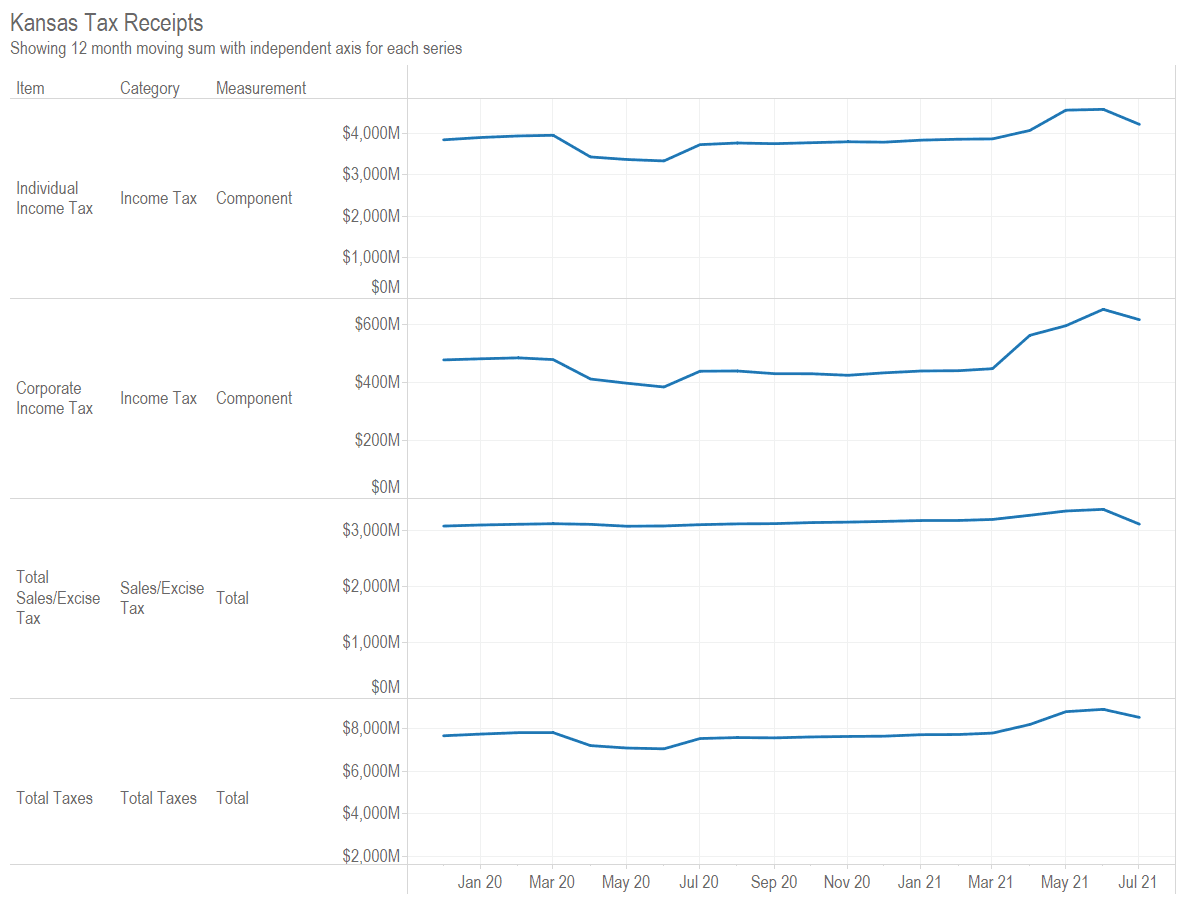
Kansas tax revenue, July 2021
For July 2021, Kansas tax revenue was 38.6 percent less than July 2020. There are important caveats to consider.
-
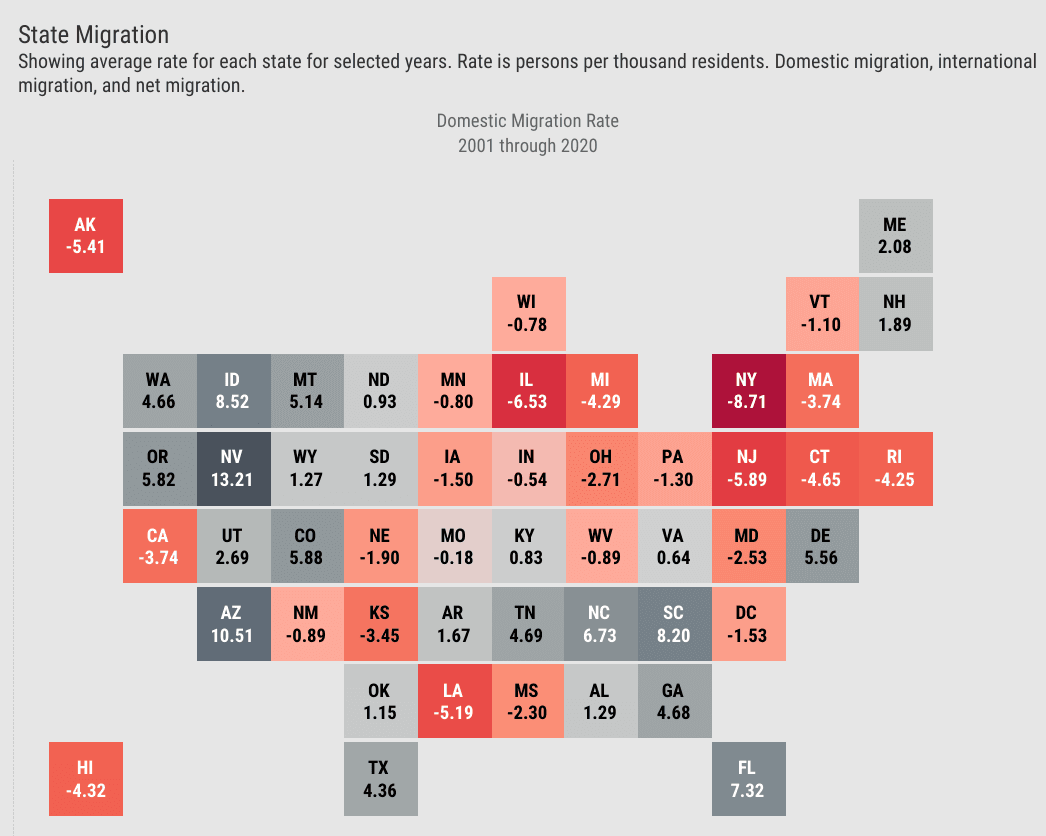
Migration trends in Kansas
New U.S. Census Bureau data shows that Kansas continues to have low rates of domestic migration, with more people moving from Kansas than moving to the state.
-
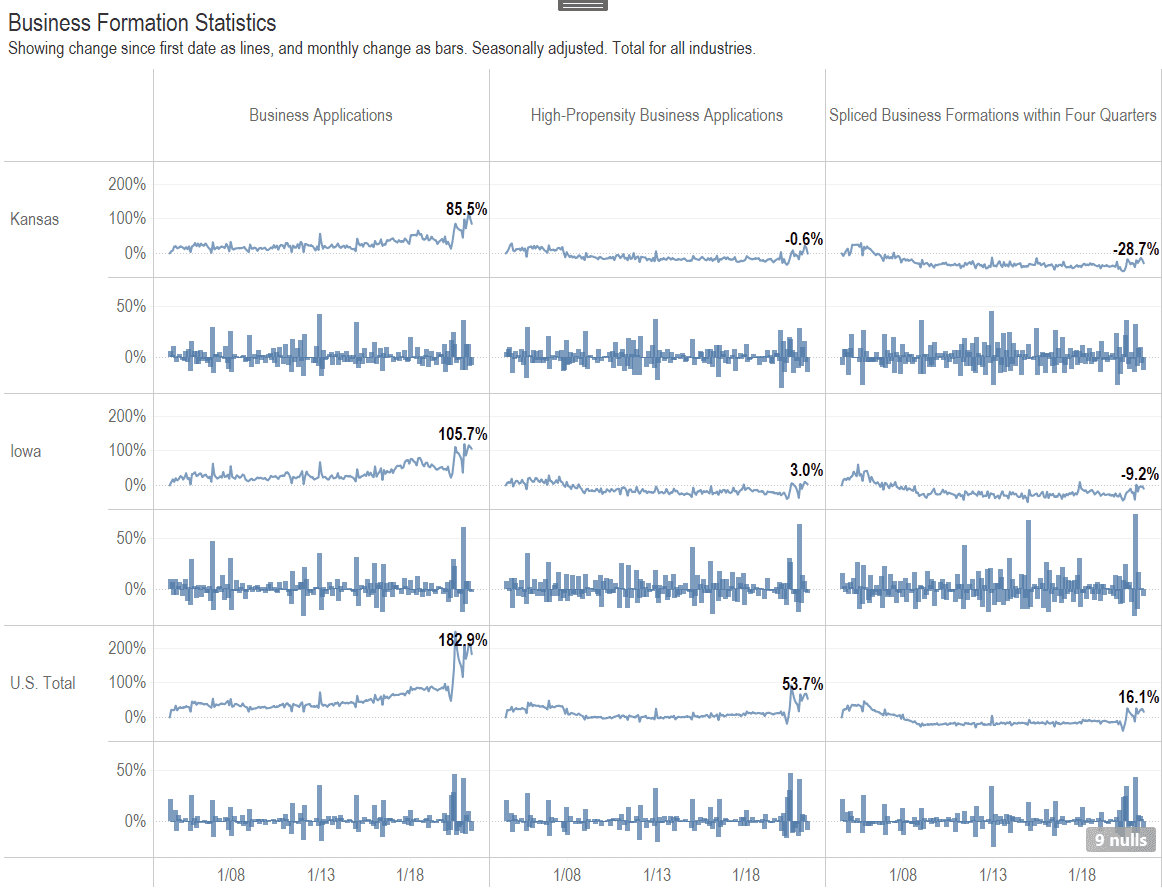
Business Formation in Kansas
For both business applications and business formations, Kansas is growing slowly compared to other states.
-
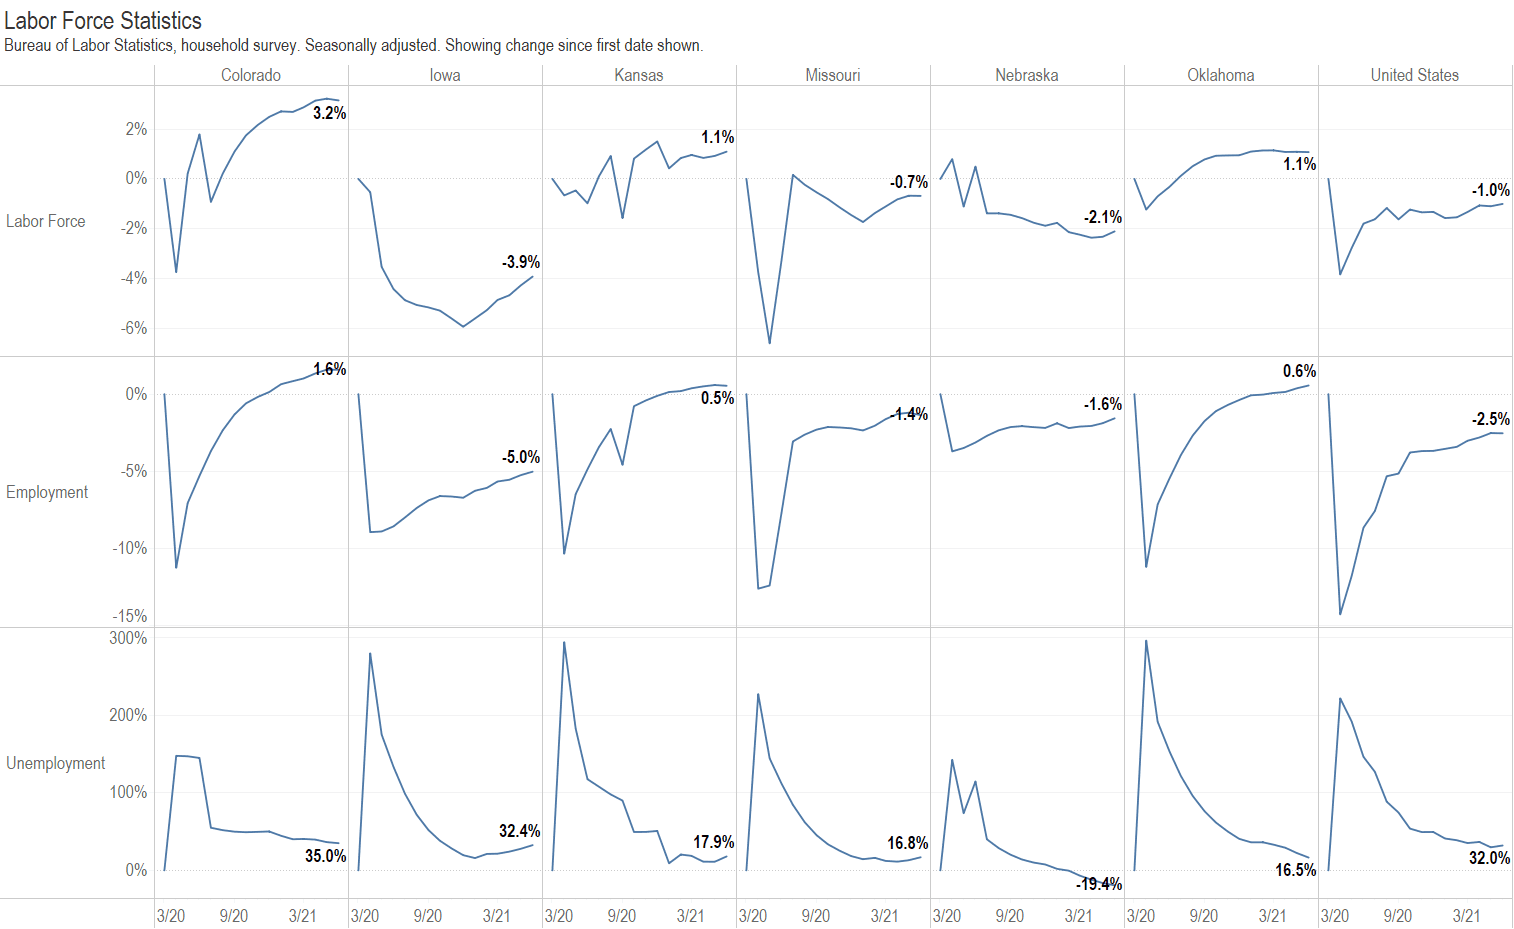
Kansas since the start of the pandemic
How has Kansas fared since the start of the pandemic compared to other states and the nation? Updated through June 2021.
-
Inflation jumps in June 2021
In June 2021, inflation rose faster than at any time since 2008.
-
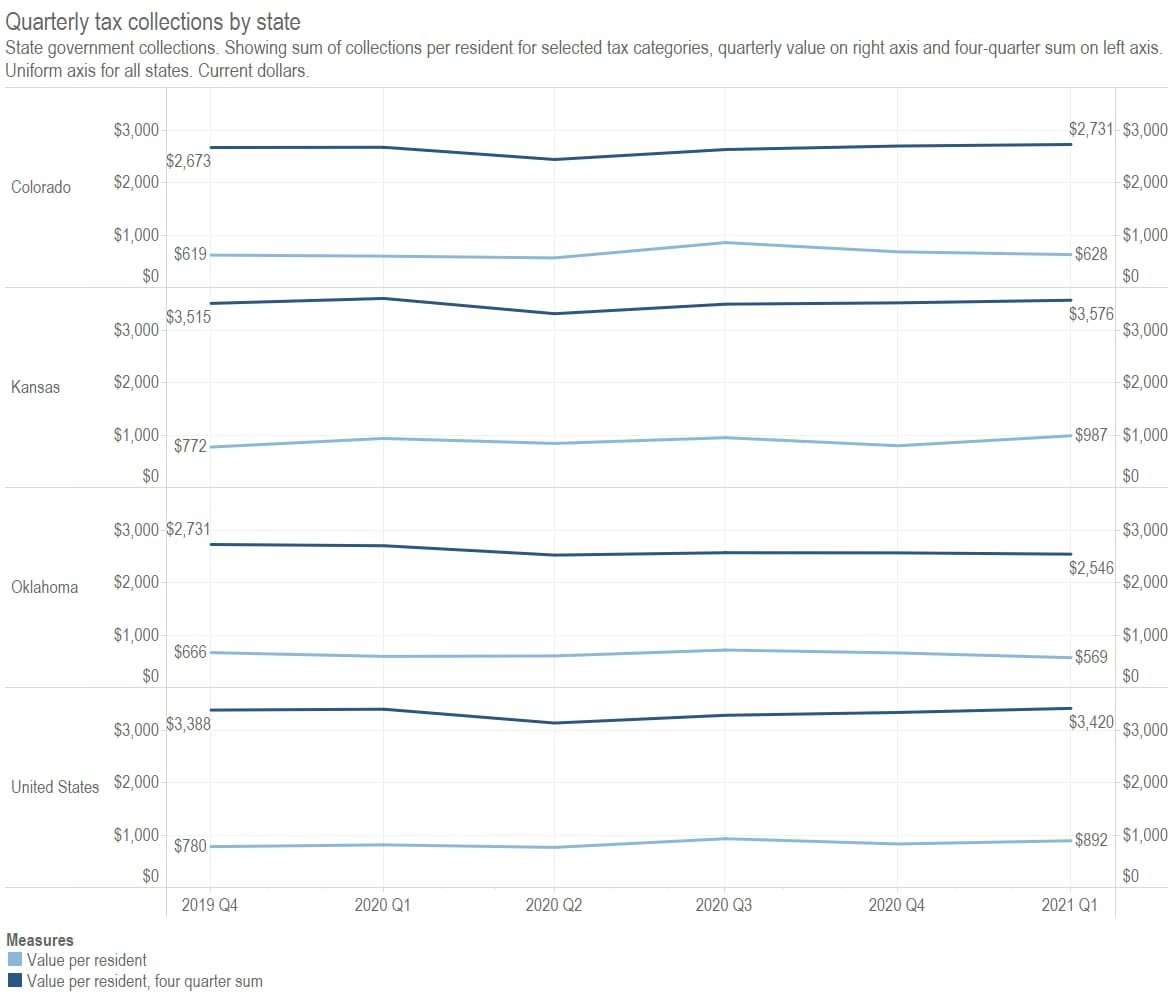
State tax collections during the pandemic
In Kansas, as in many states, tax revenues have not been a problem.
-
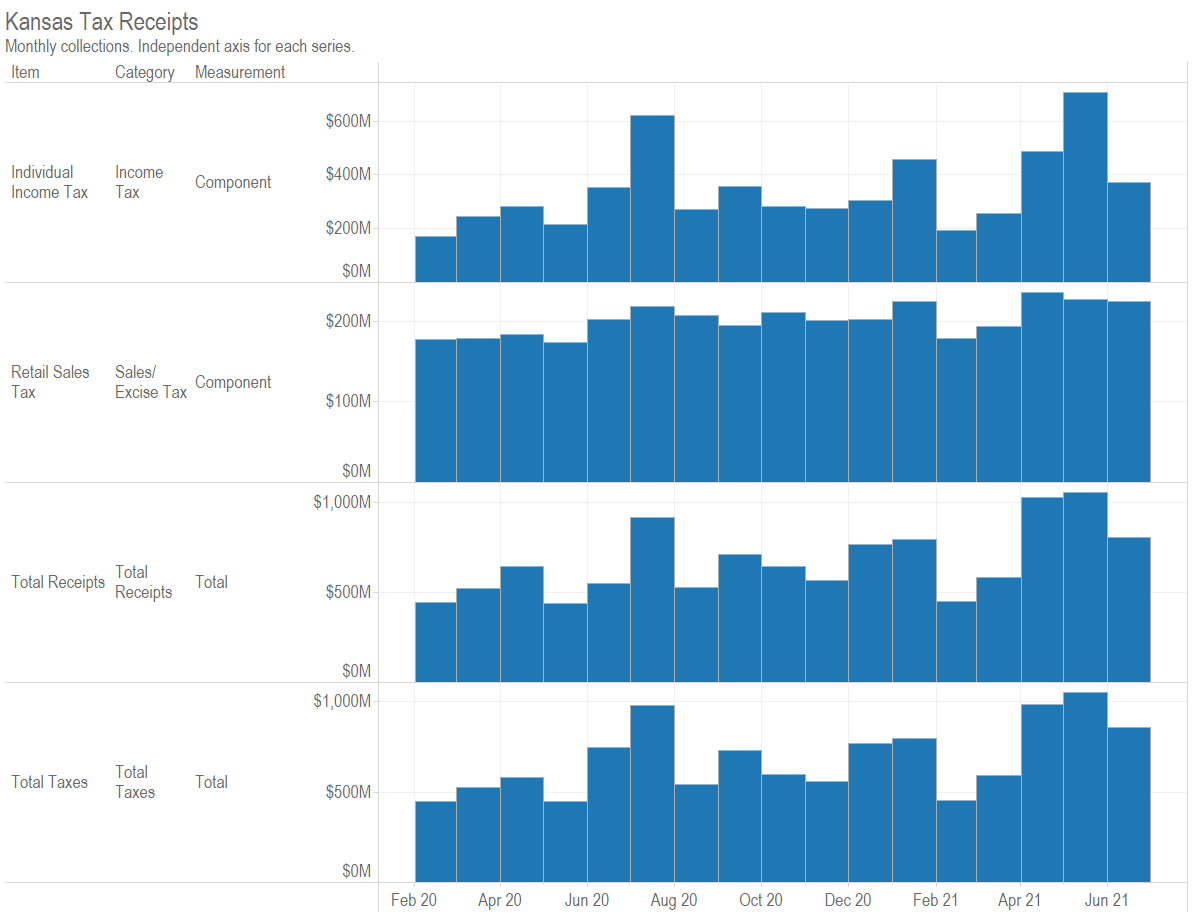
Kansas tax revenue, June 2021
For June 2021, Kansas tax revenue was 14.8 percent greater than June 2020. Over the twelve months of the current fiscal year, revenue is 26.4 percent higher than at the same point of the previous year. There are important caveats to consider.
-
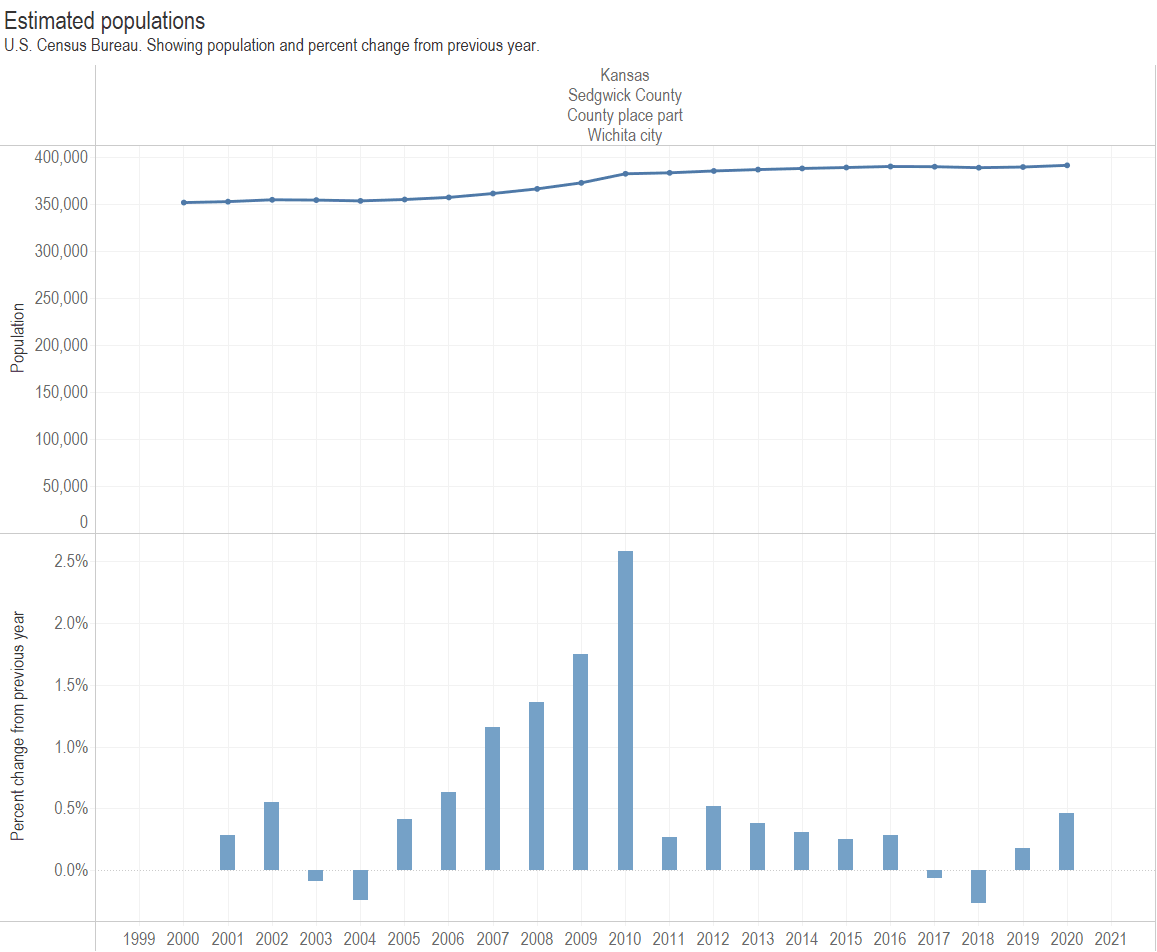
Wichita city population rises in 2020
Wichita city population rose in 2020. It was the second year of increase after two years of decline.
-
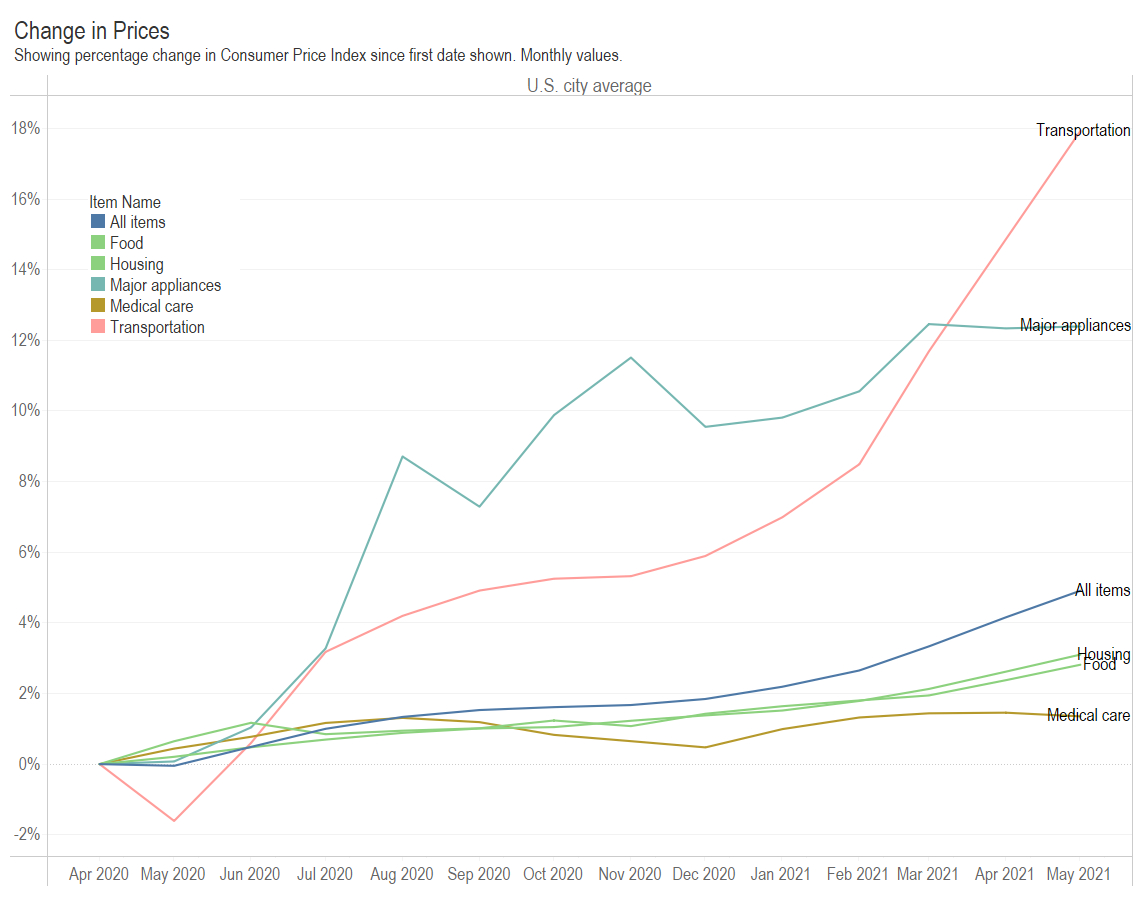
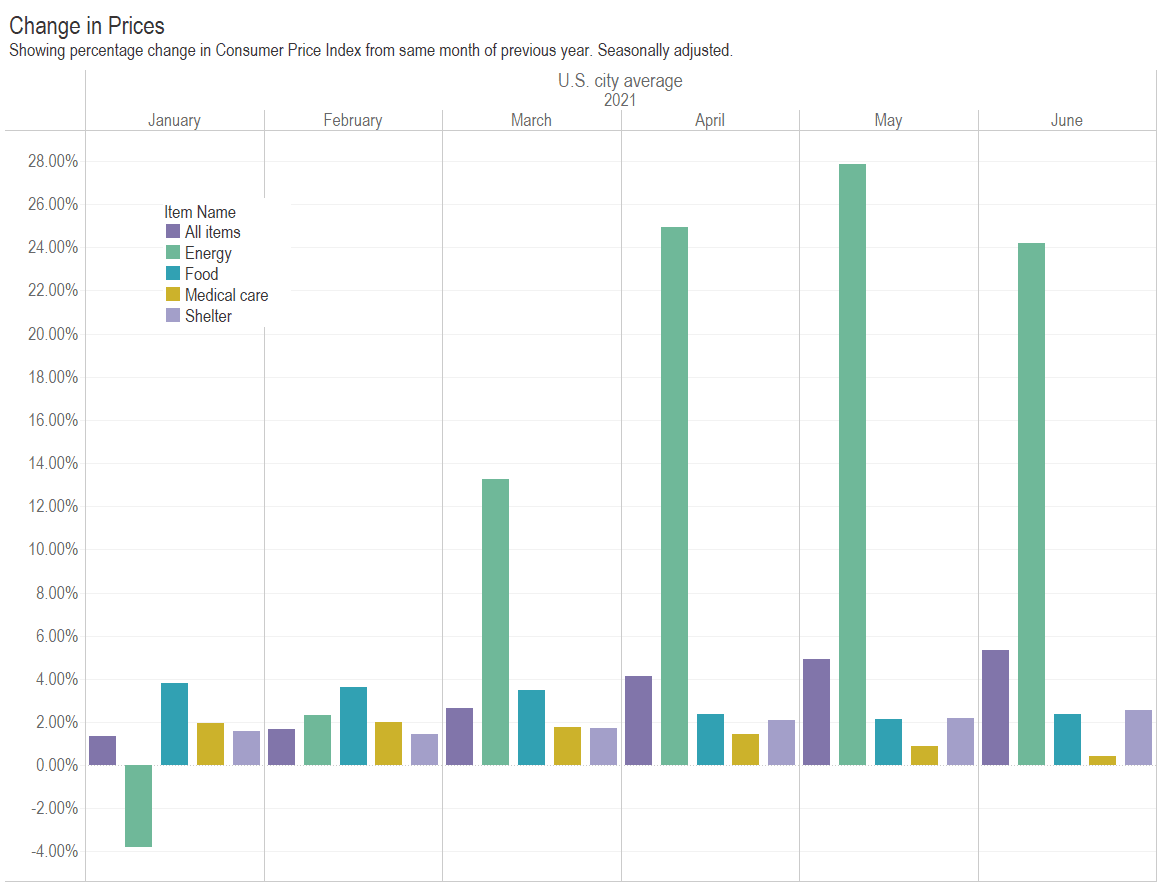
Inflation has (maybe) accelerated
The Consumer Price Index is rising, although not evenly for every item category.