Tag: Visualizations
-
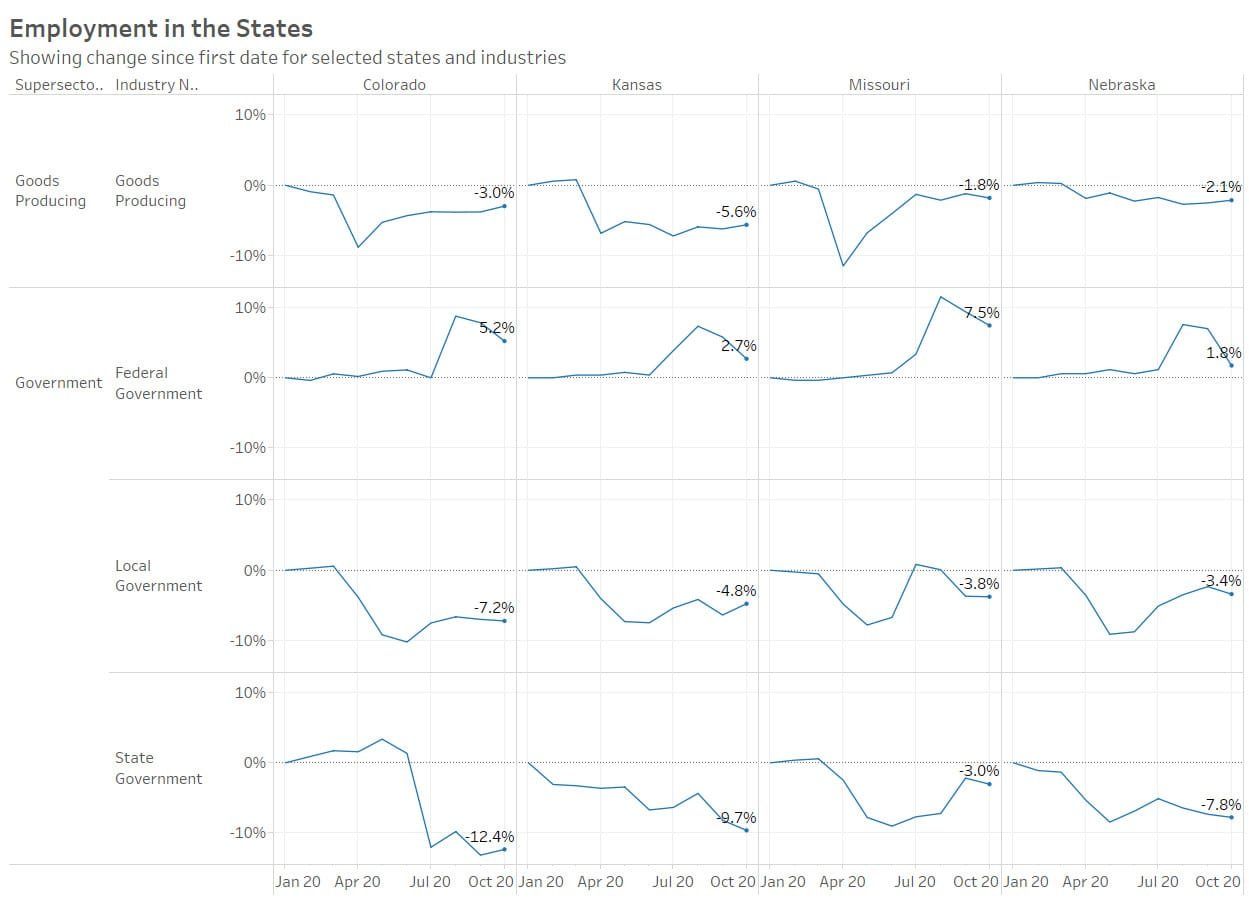
Updated: Effects of pandemic on employment in states
The effects of the response to the pandemic vary widely among the states.
-

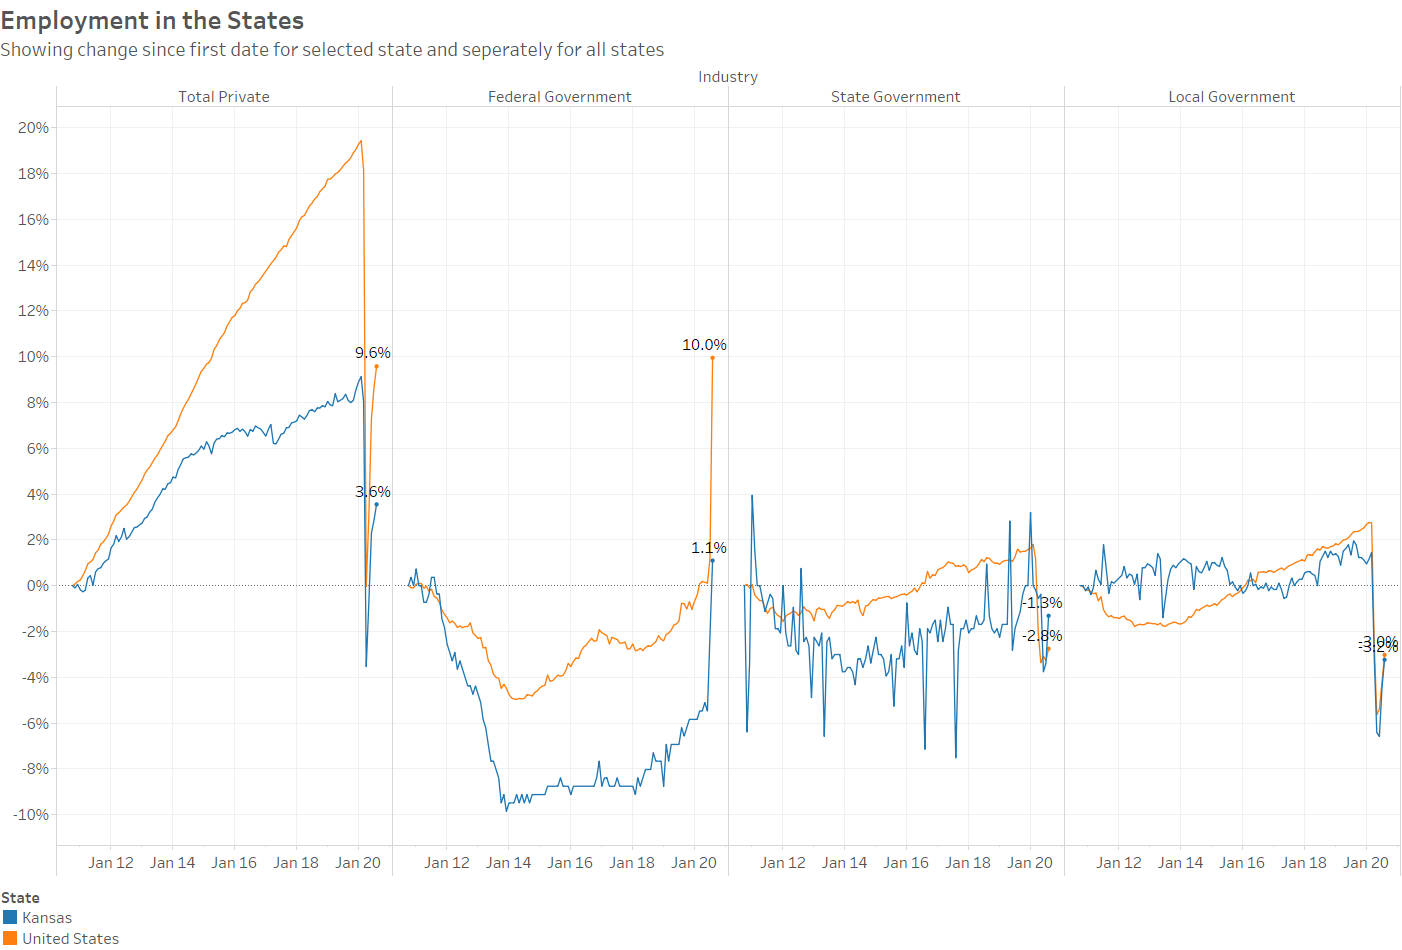
Updated: National employment
An interactive visualization of employment data, updated through October 2020.
-

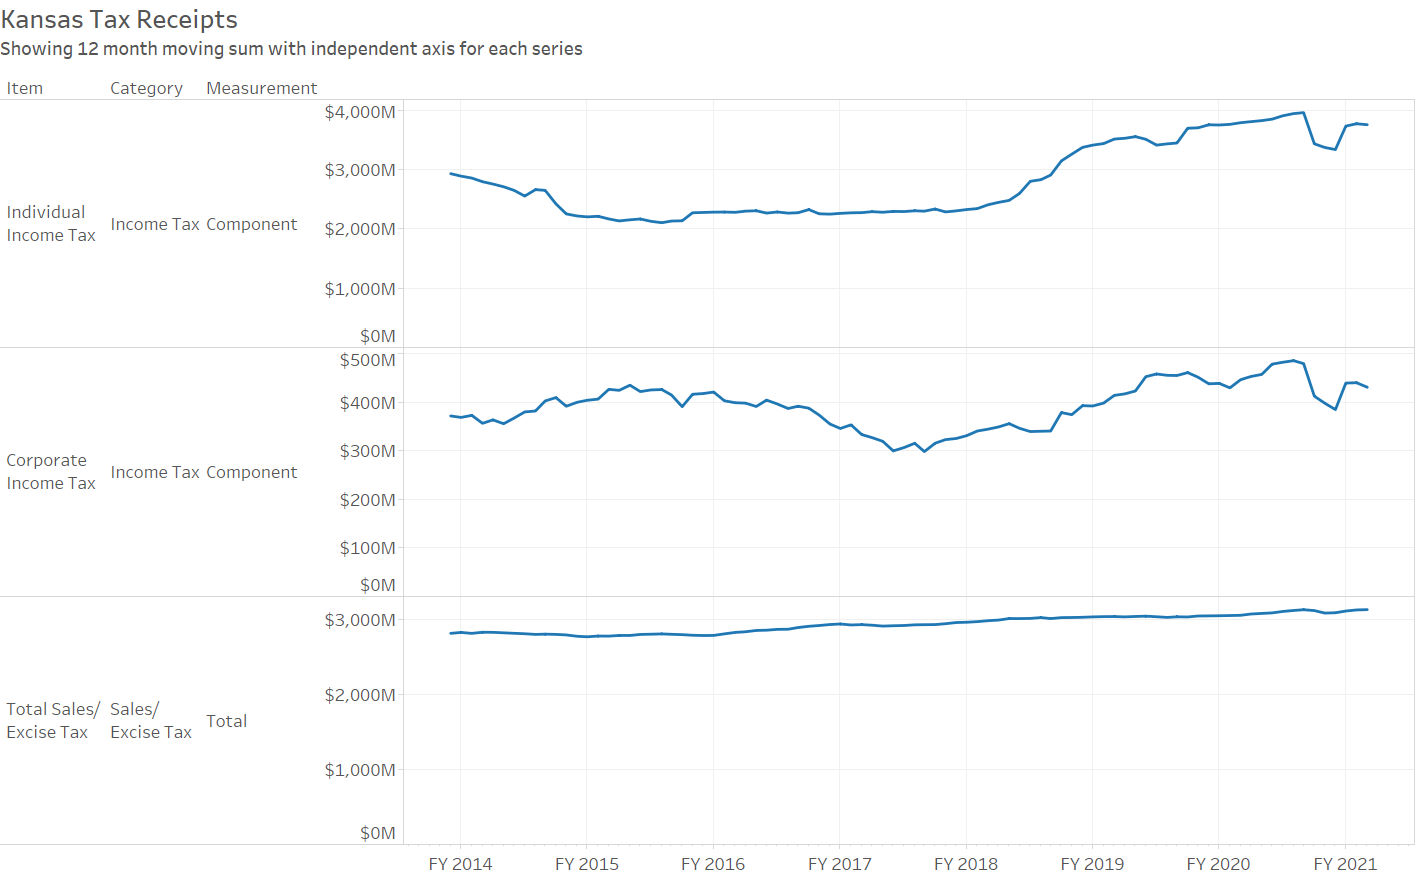
Kansas tax revenue, October 2020
For October 2020, total Kansas tax revenue was 7.9 percent greater than last October. Over the four months of the current fiscal year, tax revenue rose by 24.4 percent.
-
Updated: Effects of pandemic on employment in states
The effects of the response to the pandemic vary widely among the states, but federal government employment has been little affected.
-
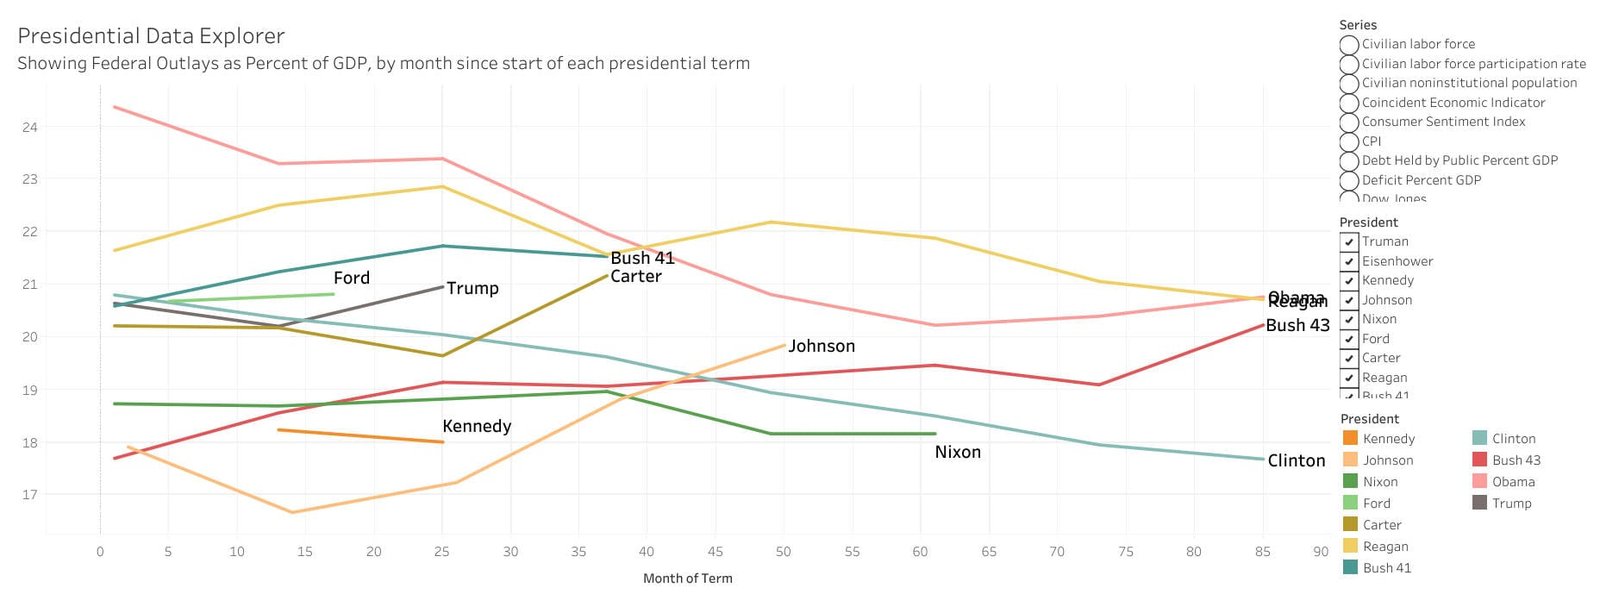
Presidential data explorer
Explore the economic record of presidents in an interactive visualization.
-

Downtown Wichita attraction attendance
Attendance at downtown Wichita attractions presented in an interactive visualization.
-

Local government employment in Kansas
Kansas has nearly the highest number of local government employees per resident, compared to other states.
-

Kansas government employment and payroll by function
Looking at the number of state government employees in proportion to population, Kansas has many compared to other states.
-
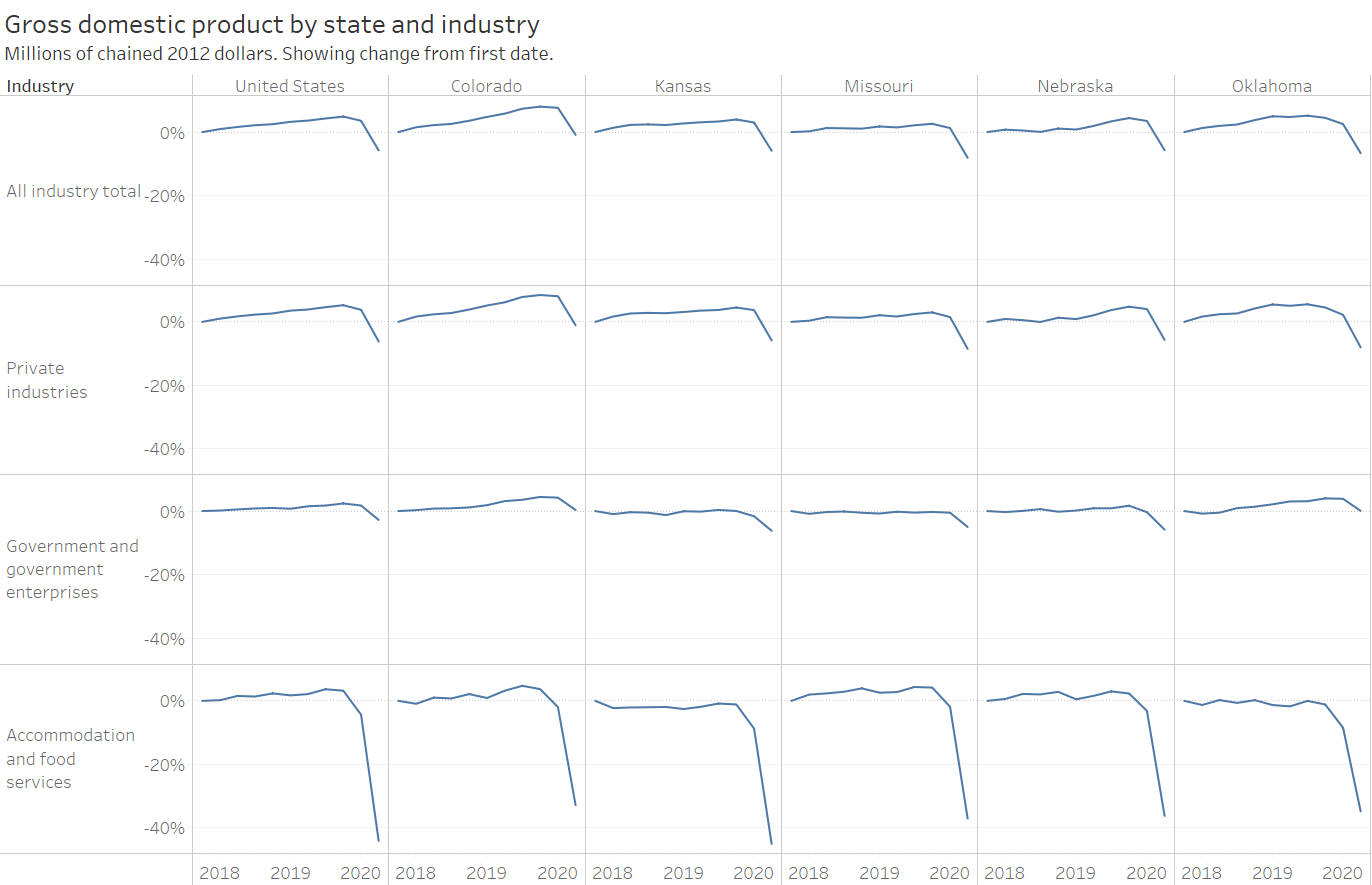
GDP by state and industry illustrates the pandemic’s effect
Recent GDP data shows the sharp effects of the pandemic on production, but it is not uniform among the states and industries.
-

Presidential approval
Explore and compare the approval ratings of presidents in this interactive visualization.
-
Kansas tax revenue, September 2020
For September 2020, total Kansas tax revenue fell by 2.0 percent from last September. Over the three months of the current fiscal year, tax revenue rose by 29.7 percent.
-

Metropolitan area employment, August 2020
Data released today shows the effects of the response to the pandemic in the metropolitan areas for August 2020. This is an interactive visualization.