Tag: Visualizations
-
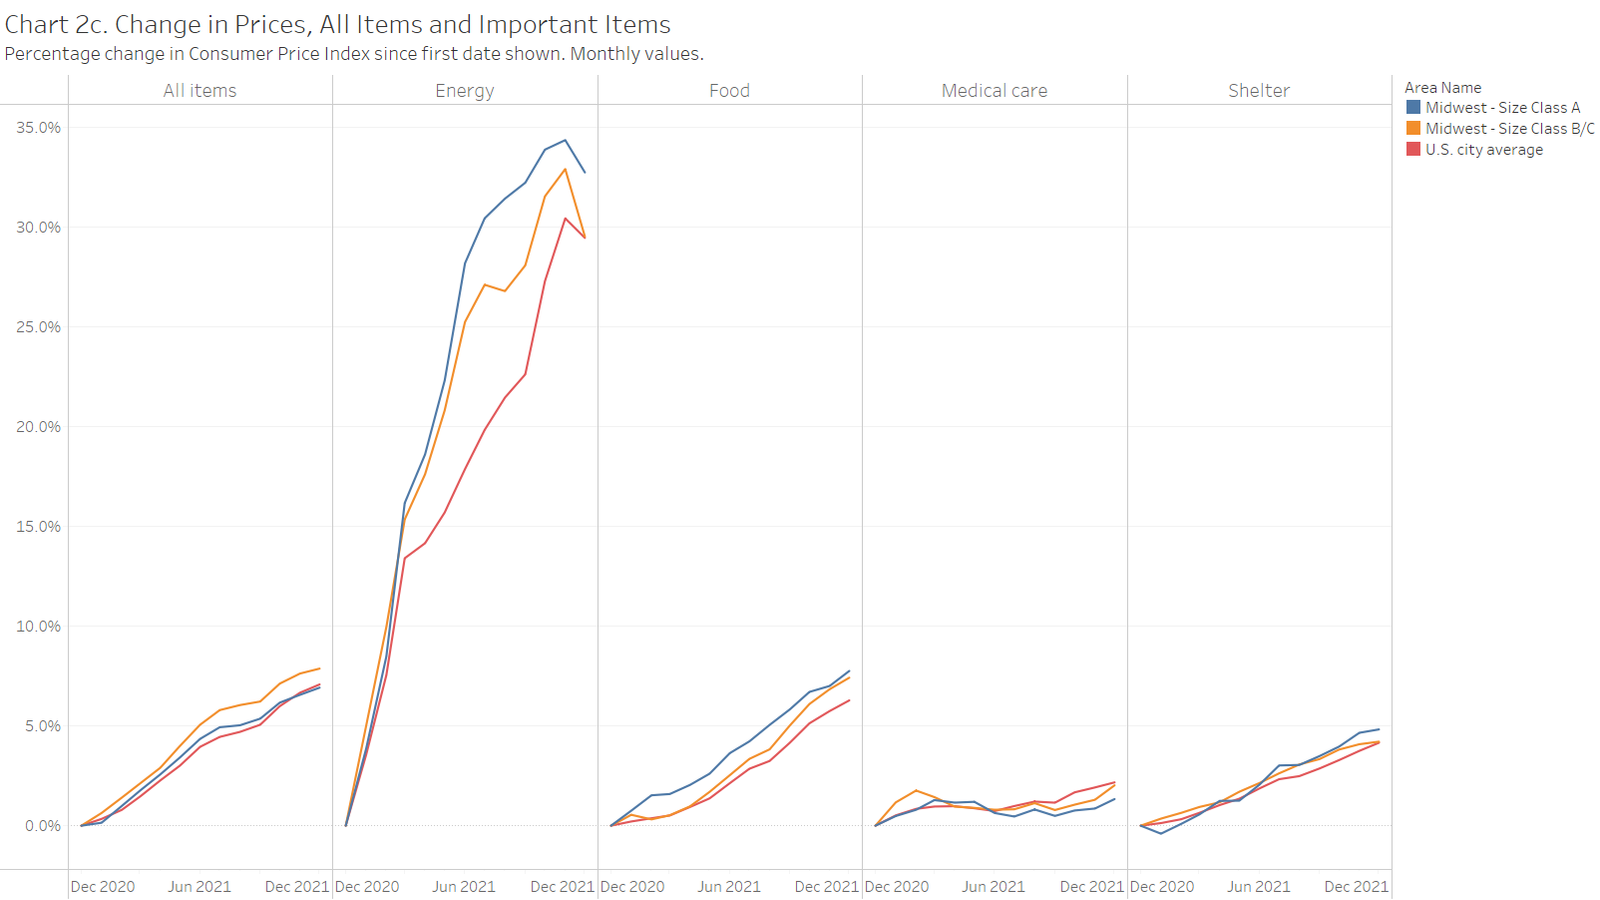
Inflation still high in December
In December 2021, inflation remains high, although the rate of increase has slowed.
-
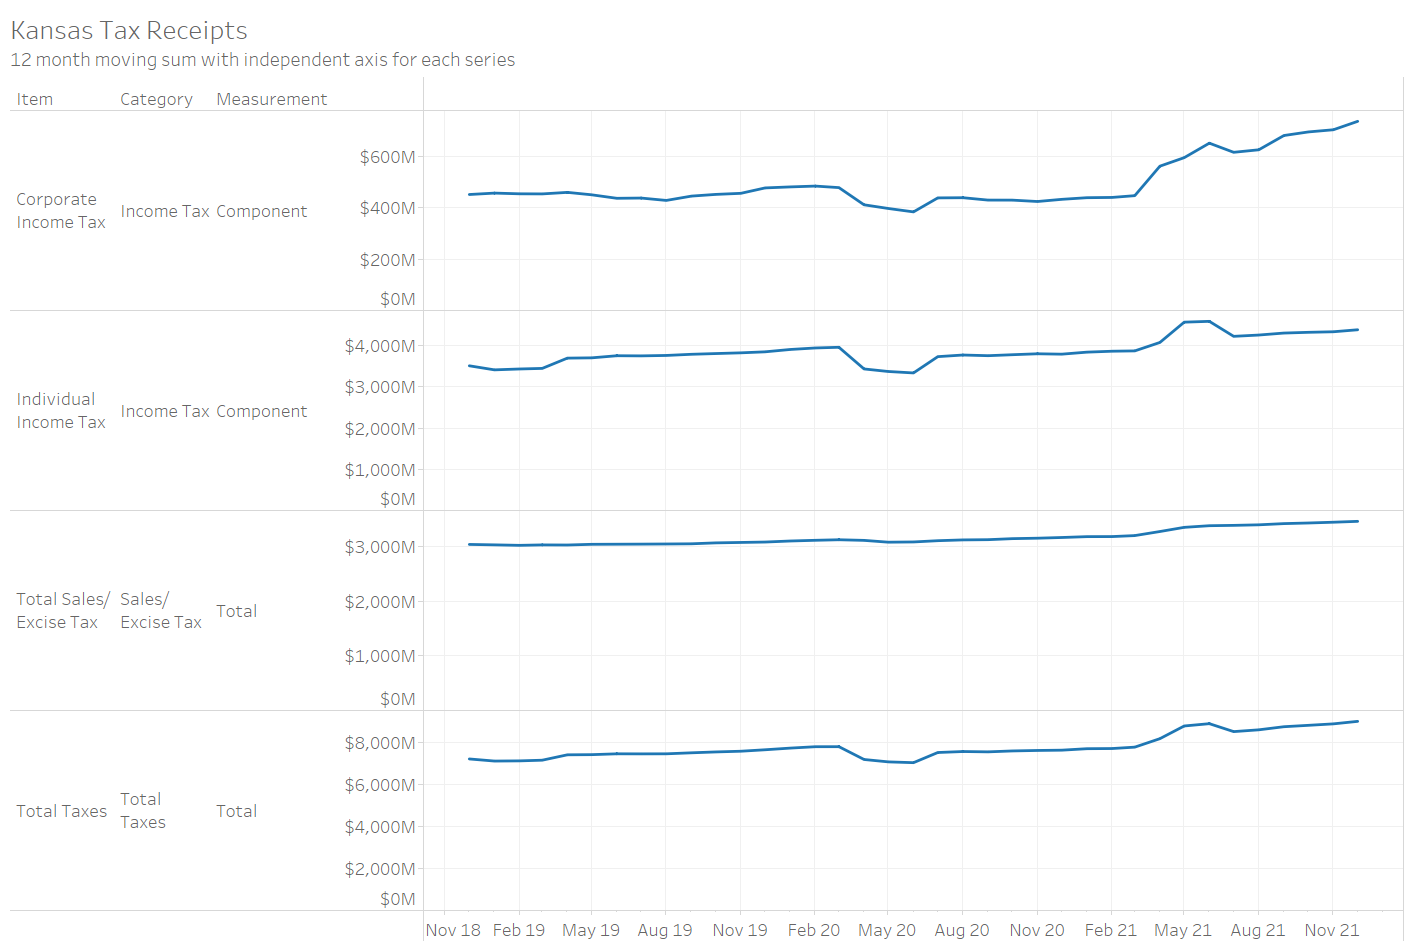
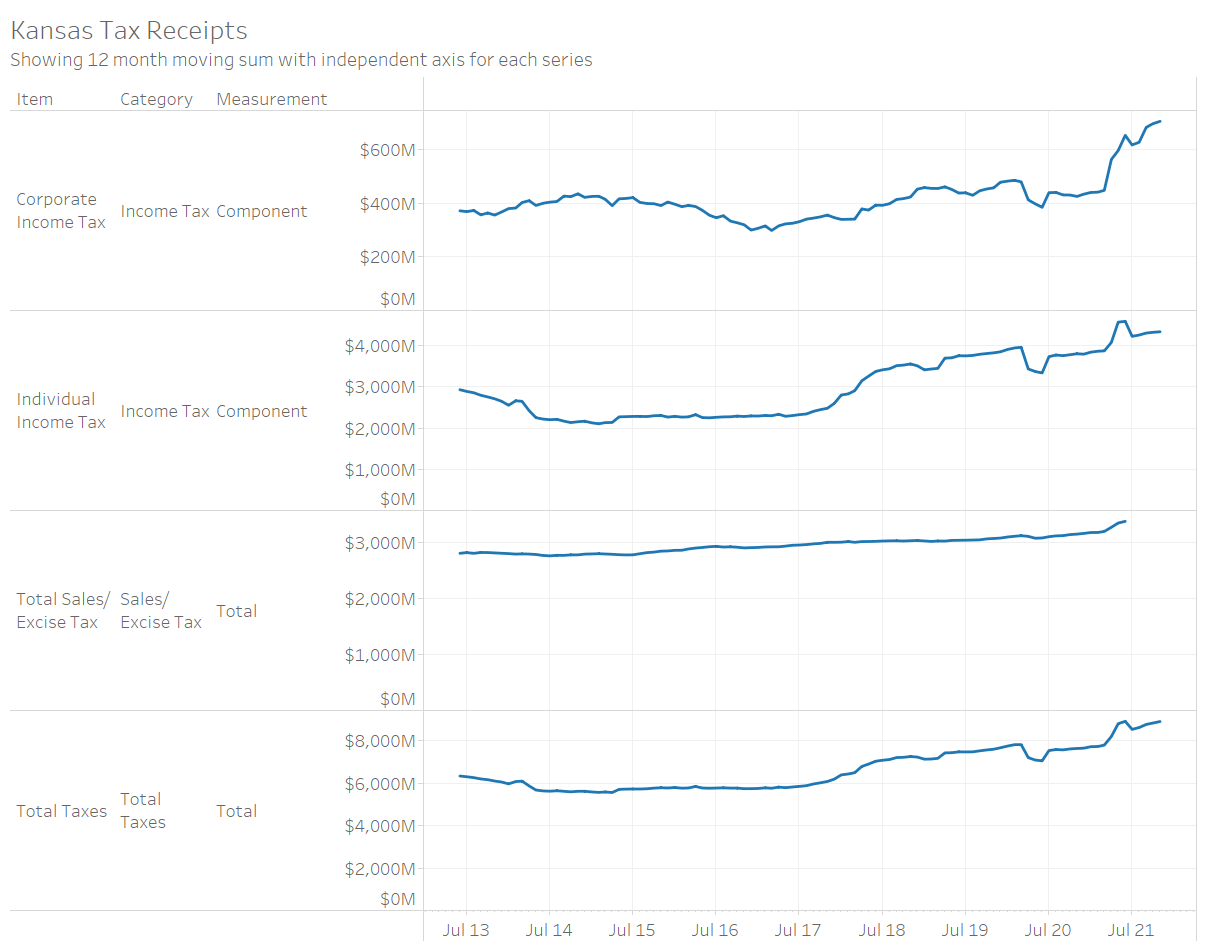
Kansas tax revenue, December 2021
For December 2021, Kansas tax revenue was 15.6 percent greater than December 2020, and 42.0 percent more than November.
-
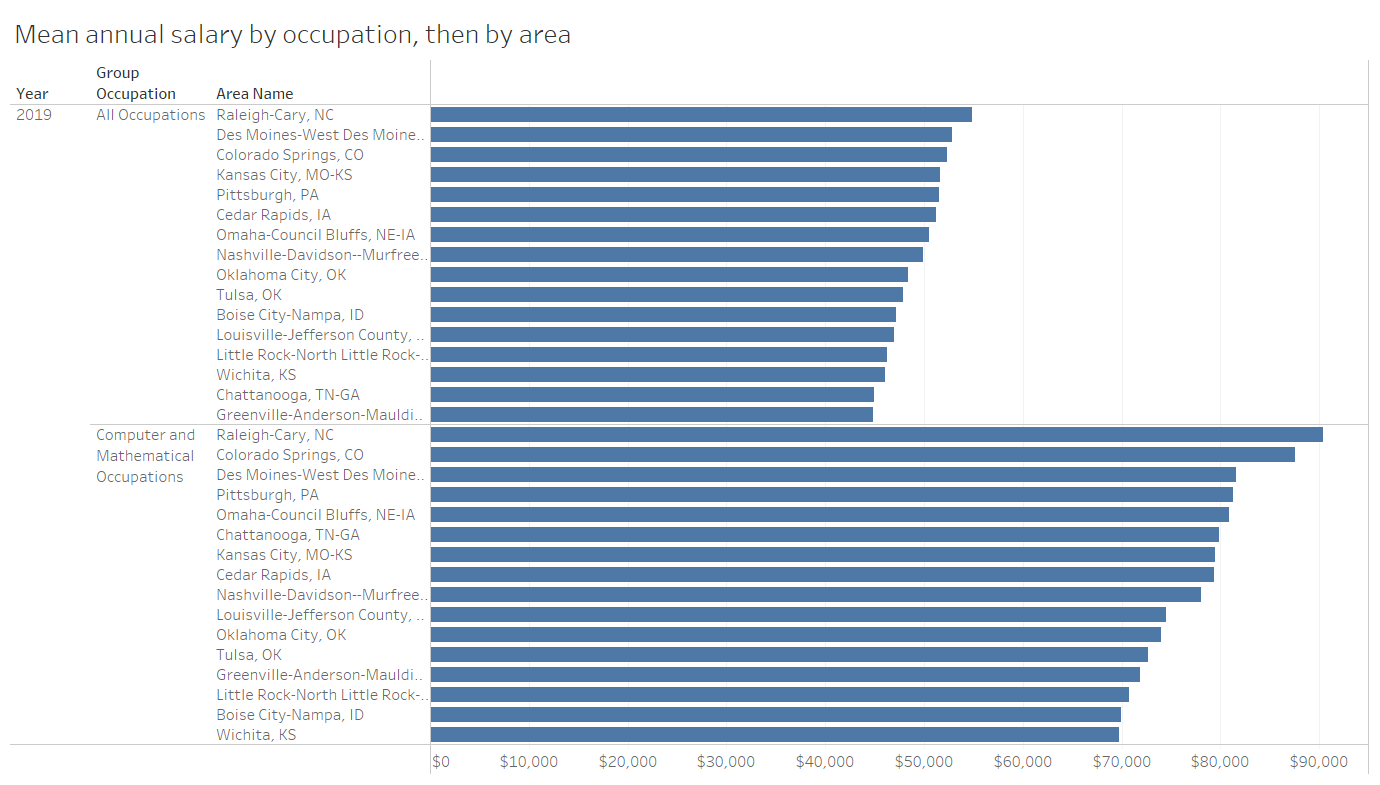
Information Technology in Wichita
While Wichita economic development leaders have tried to turn Wichita into a hub of information technology-related industry, it has not worked so far.
-

Wichita since the start of the pandemic (and the past decade)
How has Wichita fared since the start of the pandemic compared to other metropolitan areas?
-
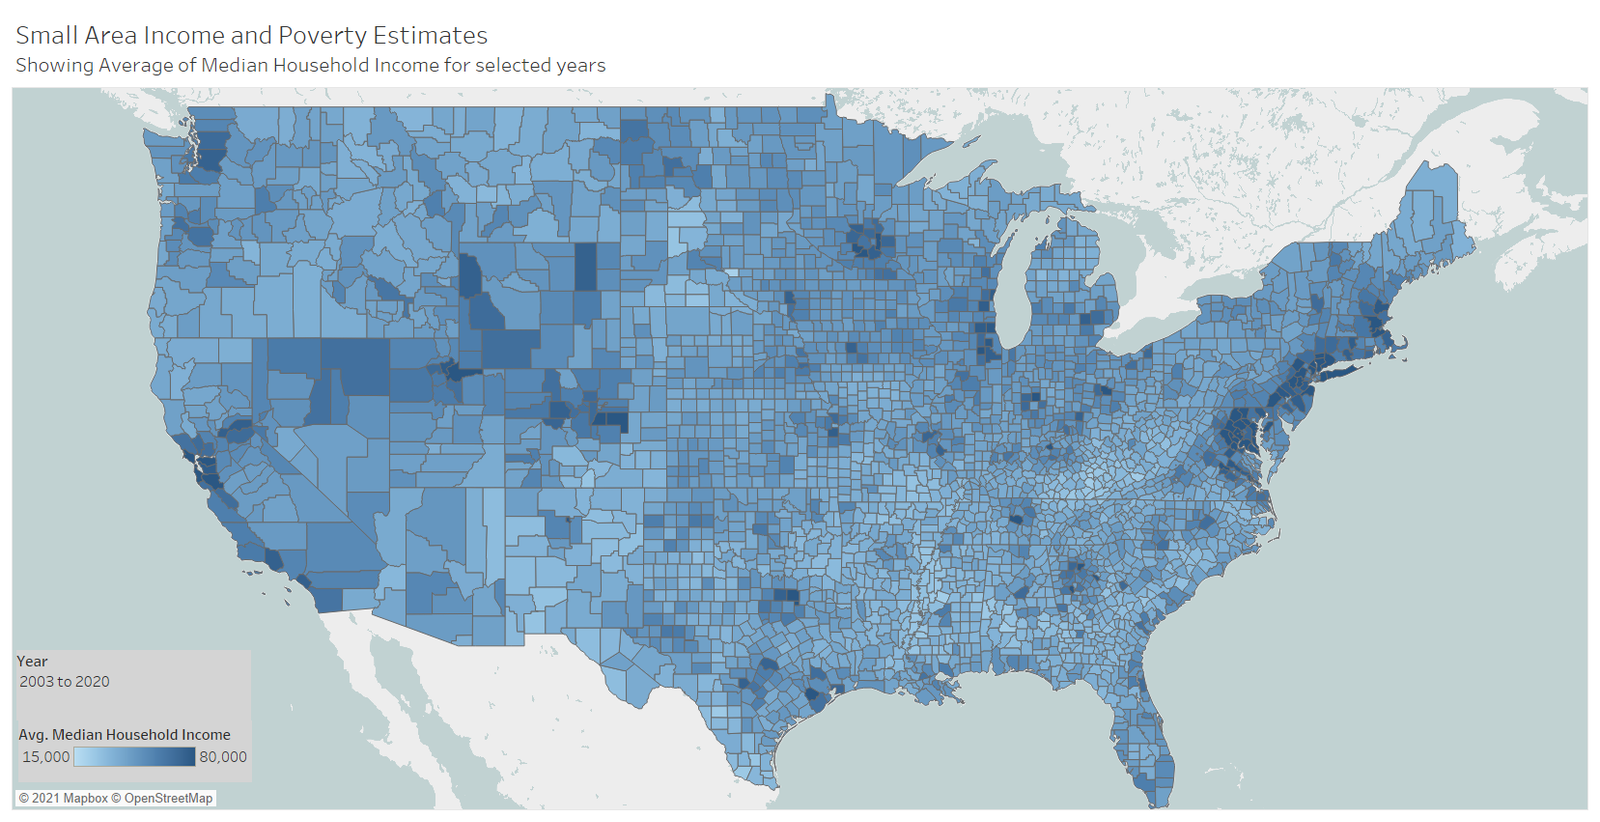
Poverty and Income in Kansas
An interactive visualization of household income and poverty data for states and counties.
-

Real Personal Income for Metropolitan Areas
An interactive visualization of real personal income in metropolitan areas.
-

Gross Domestic Product in Kansas Counties
Examining the economy of Kansas counties in an interactive visualization.
-
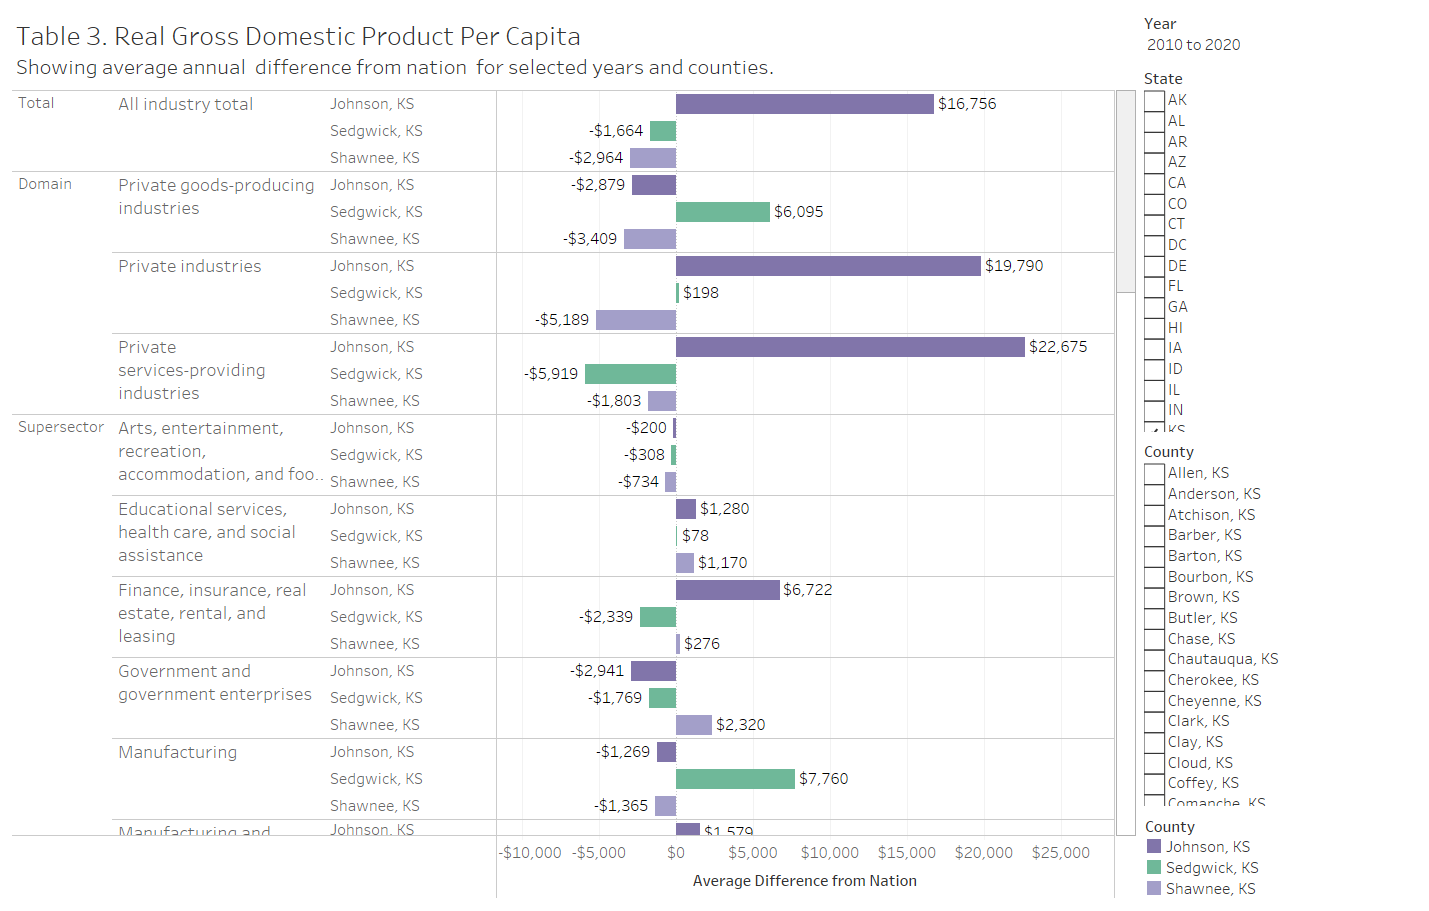
Gross Domestic Product by County and Industry
A visualization of real gross domestic product in counties by industry. Examples from Kansas included.
-
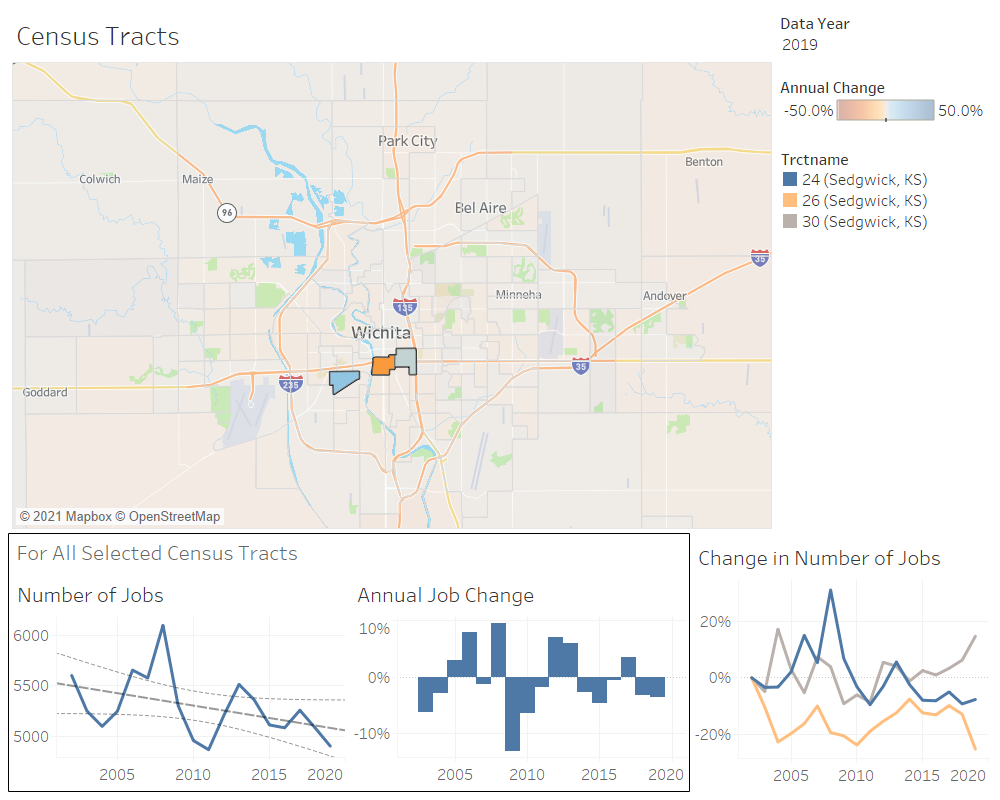
Jobs in Kansas Census Tracts
An interactive visualization of jobs and changes in Kansas census tracts.
-
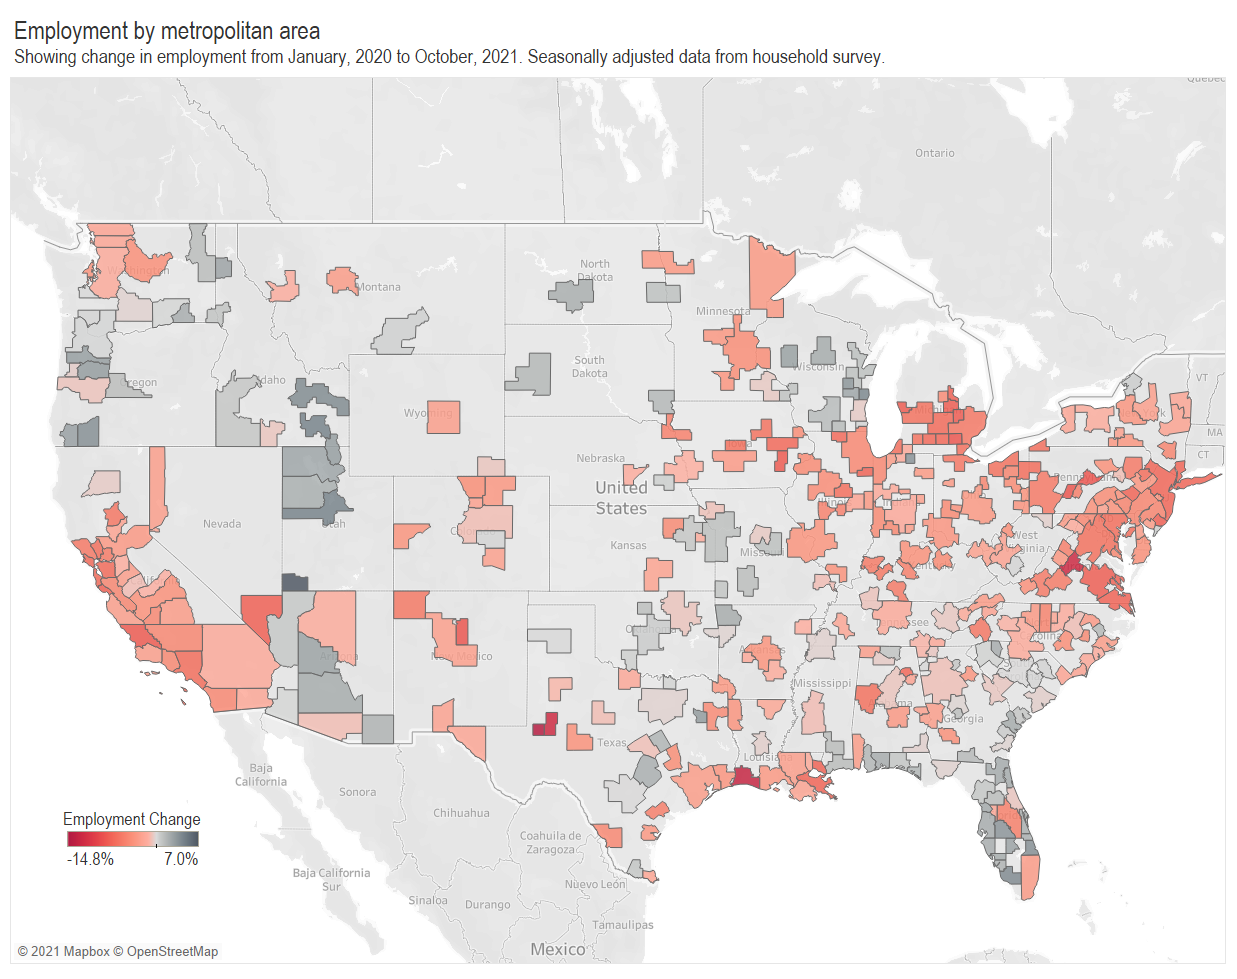
Wichita since the start of the pandemic
How has Wichita fared since the start of the pandemic compared to other metropolitan areas?
-
Kansas tax revenue, November 2021
For November 2021, Kansas tax revenue was 12.6 percent greater than November 2020, and 5.4 percent less than October.
-
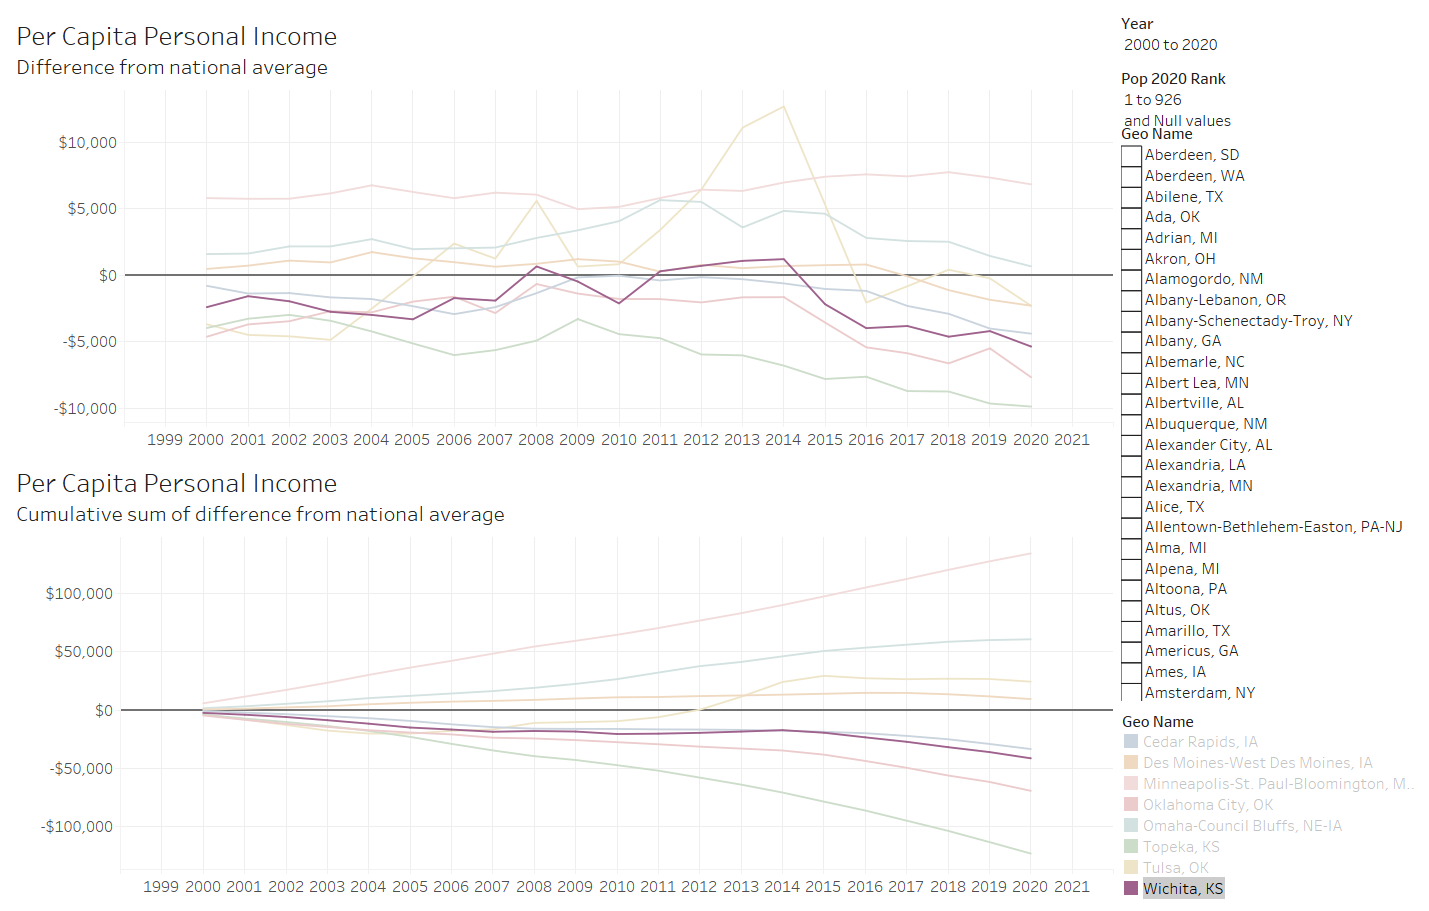
Per Capita Personal Income in Metropolitan and Micropolitan Areas
How does Wichita compare in Personal Income? We can learn in this interactive visualization of Per Capita Personal Income in urban areas in the United States.