Charts of economic indicators for Wichita, compared to Kansas and the United States.
Tag: Wichita city government

Wichita property tax rate: Up
The City of Wichita property tax mill levy rose slightly for 2020.
In 1994 the City of Wichita mill levy rate — the rate at which real and personal property is taxed — was 31.290. In 2020 it was 32.749, based on the Sedgwick County Clerk. That’s an increase of 1.459 mills, or 4.66 percent, since 1994. (These are for taxes levied by the City of Wichita only, and do not include any overlapping jurisdictions.)

Zip code populations
An interactive visualization of population by zip codes shows the parts of Wichita that are growing.
As part of its American Community Survey program, the United States Census Bureau produces estimates of population in zip codes. I’ve gathered this data for ten years and present it in an interactive visualization.

Wichita jobs and employment, November 2020
For the Wichita metropolitan area in November 2020, the number of unemployed persons is up, the unemployment rate is up, and the number of people working is down, all by large amounts, when compared to the same month one year ago. The recent trend, however, is mixed.

Downtown Wichita jobs rise
The reported number of jobs in Downtown Wichita rose in 2018, but there is an issue with the data.

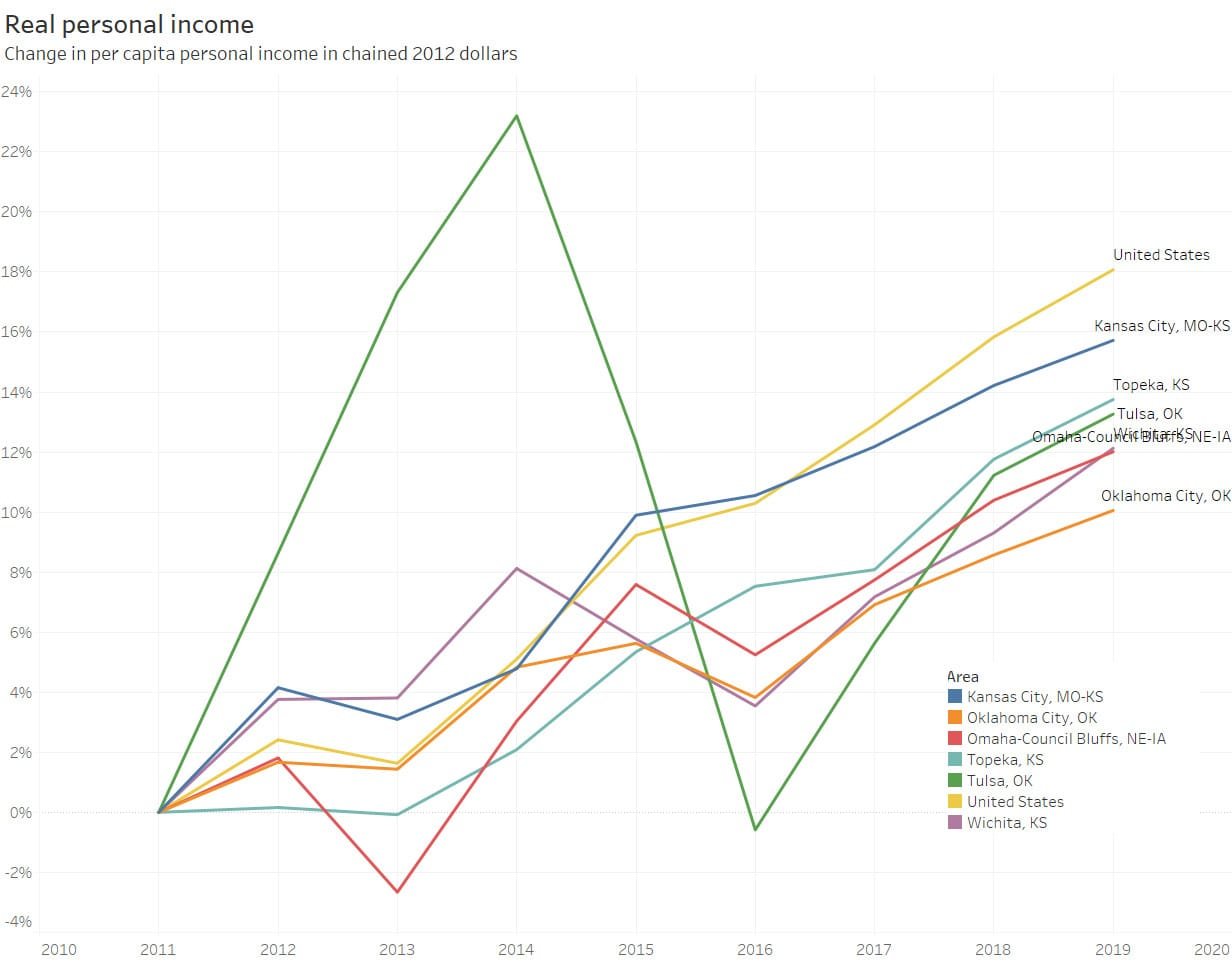
Real personal income in Wichita and other metropolitan areas
When adjusted for regional differences, per capita personal income in Wichita is relatively high. In recent years growth in per capita and total personal income has been slow, but better in 2019.
The Bureau of Economic Analysis, a division of the United States Department of Commerce, generates personal income data for the nation, the states, and metropolitan statistical areas, or MSAs. Today BEA released data for 2019, and I present the metro data in an interactive visualization.
When presenting economic data, the term “real” commonly means that dollar amounts have been adjusted for the effects of inflation. That is the case for this data. BEA goes further in also adjusting data for regional price parity and personal consumption expenditures price index.
The difference when using values adjusted for regional differences can be substantial. For example, when considering per capita personal income in 2019 using current, non-adjusted dollars, Wichita ranks number 113 among the nation’s 384 metropolitan areas. When adjusted for region, Wichita ranks number 56.
In the example for some nearby metro areas, Wichita’s per capita personal income is near the middle at $54,460. But since 2011, Wichita per capita personal income has grown slowly, rising by 12 percent while the national value grew by 18 percent. For the same period, total personal income in Wichita grew by 15 percent, while the nation grew by 24 percent. For Wichita, 2019 was an improvement from 2018.

Click for larger. 
Click for larger. 
Click for larger. To learn more about this data and access the interactive visualizations, click here.

Downtown Wichita population is up
New Census Bureau data shows the downtown Wichita population growing in 2019.
Data released today by the United States Census Bureau shows the estimated population for zip code 67202 in 2019 was 1,751, an increase of 80 from the prior year.
Zip code 67202 is greater downtown Wichita, from the Arkansas River east to Washington, and Kellogg north to Central, roughly.
The source of this data is U.S. Census Bureau, 2015-2019 American Community Survey 5-Year Estimates. This is not the Bureau’s estimate of the population in 2019. This is because for areas of population less than 65,000, the Bureau does not provide one-year estimates. Instead, the five-year estimates use data gathered over a longer time period in order to provide greater accuracy.
The Bureau cautions that the five-year estimates should not be used as the population of the year in the midpoint of the five-year period: “Therefore, ACS estimates based on data collected from 2011–2015 should not be labeled ‘2013,’ even though that is the midpoint of the 5-year period.” (See below for more about these data.)
Additionally, the Bureau issues this advice: “However, in areas experiencing major changes over a given time period, the multiyear estimates may be quite different from the single-year estimates for any of the individual years.” Downtown Wichita, I believe, qualifies as an area “experiencing major changes.” The five-year estimates must be considered in light of this advice.
Still, as shown in the nearby table and charts, the ACS population numbers are far below the population reported by the downtown Wichita development agency Downtown Wichita. (See my article Downtown Wichita population for more about this topic from a previous year.)
The 90 percent confidence interval for the 2019 estimate is plus or minus 256 persons. This means the Bureau is confident the population is between 1,495 and 2,007, with 90 percent probability.
Note that Downtown Wichita — the development agency — reports the downtown population as 2,778, which is 58.7 percent higher than the Census Bureau. It is extraordinarily unlikely that the Downtown Wichita numbers are anything near the actual population.
Click charts and tables for larger versions.


Following, excerpts from the Census Bureau publication Understanding and Using American Community Survey Data: What All Data Users Need to Know.
Understanding Period Estimates
Single-year and multiyear estimates from the ACS are all “period” estimates derived from a sample collected over a period of time, as opposed to “point-in-time” estimates such as those from past decennial censuses. For example, the 2000 Census “long form” sampled the resident U.S. population as of April 1, 2000.While an ACS 1-year estimate includes information collected over a 12-month period, an ACS 5-year estimate includes data collected over a 60-month period.
In the case of ACS 1-year estimates, the period is the calendar year (e.g., the 2015 ACS covers the period from January 2015 through December 2015). In the case of ACS multiyear estimates, the period is 5 calendar years (e.g., the 2011–2015 ACS estimates cover the period from January 2011 through December 2015). Therefore, ACS estimates based on data collected from 2011–2015 should not be labeled “2013,” even though that is the midpoint of the 5-year period.
Multiyear estimates should be labeled to indicate clearly the full period of time (e.g., “The child poverty rate in 2011–2015 was X percent.”). They do not describe any specific day, month, or year within that time period.
Multiyear estimates require some considerations that single-year estimates do not. For example, multiyear estimates released in consecutive years consist mostly of overlapping years and shared data.
The primary advantage of using multiyear estimates is the increased statistical reliability of the data compared with that of single-year estimates, particularly for small geographic areas and small population subgroups. Figure 3.2 shows the improved precision of an ACS 5-year estimate, compared with a 1-year estimate, for child poverty statistics in Rice County, Minnesota—a county with about 65,000 residents in 2015. The lines above and below the point estimates represent the confidence intervals, or ranges of uncertainty, around each estimate. The confidence interval for the 1-year child poverty estimate ranges from 1.4 percent to 9.4 percent (8 percentage points) while the interval for the 5-year estimate is narrower, ranging from 12.8 percent to 19.2 percent (6 percentage points). (Refer to the section on “Understanding Error and Determining Statistical Significance” for a detailed explanation of uncertainty in ACS data.)
Deciding Which ACS Estimate to Use
For data users interested in obtaining detailed ACS data for small geographic areas (areas with fewer than 65,000 residents), ACS 5-year estimates are the only option.The 5-year estimates for an area have larger samples and smaller margins of error than the 1-year estimates. However, they are less current because the larger samples include data that were collected in earlier years. The main advantage of using multiyear estimates is the increased statistical reliability for smaller geographic areas and small population groups.
However, in areas experiencing major changes over a given time period, the multiyear estimates may be quite different from the single-year estimates for any of the individual years. The single year and multiyear estimates will not be the same because they are based on data from two different time periods.

Wichita jobs and employment, October 2020
For the Wichita metropolitan area in October 2020, the number of unemployed persons is up, the unemployment rate is up, and the number of people working is down, all by large amounts, when compared to the same month one year ago. The recent trend, however, is positive.
Data released today by the Bureau of Labor Statistics, part of the United States Department of Labor, shows the effects of the response to the pandemic in the Wichita Metropolitan Statistical Area for October 2020.

Click charts and tables for larger versions.
Total nonfarm employment fell from 307,600 last October to 295,800 in October 2020, a loss of 11,800 jobs (3.8 percent). (This data is not seasonally adjusted, so month-to-month comparisons are not valid.) For the same period, employment in the nation fell by 6.0 percent. The unemployment rate in October 2020 was 6.8 percent, up from 3.1 percent one year ago.
Considering seasonally adjusted data from the household survey, the labor force rose by 6,964 persons (2.2 percent) in October 2020 from September 2020, the number of unemployed persons fell by 3,262 (12.3 percent), and the unemployment rate was 7.2 percent, down from 8.4 percent in September. The number of employed persons not working on farms rose to 298,462 in October from 288,236 the prior month, an increase of 10,226 persons (3.5 percent). (See note below.)
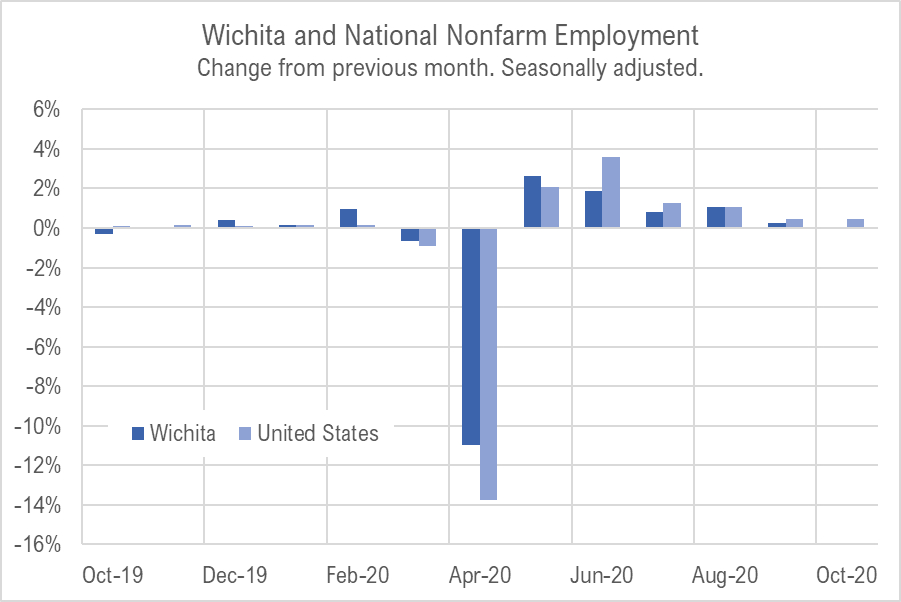
The following chart of the monthly change in the labor force and employment in Wichita shows the magnitude of the drop in April overwhelming other months, and then a positive change in employment for the following months, the months of little change, and then strong growth in October.
The following chart of changes from the same month one year ago shows a similar same trend — fewer jobs, although the difference is becoming smaller as more people return to work.
The following chart of changes in employment from the same month of the previous year shows months when the Wichita MSA performed better than the nation before the pandemic. In all months affected by the pandemic, we see the loss in employment Wichita has not been as severe as the nation.
The following chart shows the monthly change in nonfarm jobs for Wichita and the nation. For September, the number of jobs in Wichita was unchanged, while for the nation, the number grew a small amount. For the last four months, Wichita employment has been growing at a rate slower than the national rate.

The link to the archived version of the BLS news release for this month is here.
The following two charts show changes in jobs for Wichita and the nation over longer periods. The change is calculated from the same month of the previous year. For times when the Wichita line was above the nation, Wichita was growing faster than the nation. This was often the case during the decades starting in 1990 and 2000. Since 2010, however, Wichita has rarely outperformed the nation and sometimes has been far below the nation. Since the pandemic, however, Wichita has been outperforming the nation.
(For data on all metropolitan areas in the nation, see my interactive visualization Metro area employment and unemployment. It is updated through October 2020.)
A note: There are two series of employment data used by me to produce these tables and charts. One series comes from CES, the establishment survey, and another comes from a program called Smoothed Seasonally Adjusted Metropolitan Area Estimates, or SSAM. Usually, there is not much difference in the data from the two sources. For October 2020, the SSAM value is 2.0 percent higher than the CES value. For the two previous months the SSAM value was lower by 1.5 percent and 1.6 percent from the CES value. This is much larger than the average difference of 0.3 percent for the previous 18 months. I’ve inquired to BLS and will update as I find an explanation.
Wichita jobs and employment, September 2020
For the Wichita metropolitan area in September 2020, the number of unemployed persons is up, the unemployment rate is up, and the number of people working is down, all by large amounts, when compared to the same month one year ago. The recent trend, however, is positive, although Wichita is recovering slower than the nation.
Data released today by the Bureau of Labor Statistics, part of the United States Department of Labor, shows the effects of the response to the pandemic in the Wichita Metropolitan Statistical Area for September 2020.
Click charts and tables for larger versions.
Total nonfarm employment fell from 306,400 last September to 292,200 in September 2020, a loss of 14,200 jobs (4.6 percent). (This data is not seasonally adjusted, so month-to-month comparisons are not valid.) For the same period, employment in the nation fell by 6.4 percent. The unemployment rate in September 2020 was 8.0 percent, up from 3.0 percent one year ago.
Considering seasonally adjusted data from the household survey, the labor force fell by 5,050 persons (1.6 percent) in September 2020 from August 2020, the number of unemployed persons fell by 5,943 (18.3 percent), and the unemployment rate was 8.4 percent, down from 10.1 percent in August. The number of employed persons not working on farms rose to 288,236 in September from 287,343 the prior month, an increase of 893 persons (0.3 percent).
The following chart of the monthly change in the labor force and employment in Wichita shows the magnitude of drop in April overwhelming other months, and then a positive change in employment for the following months, although the change is becoming smaller and was zero for September. Note the fall in the labor force for the last two months.
The following chart of changes from the same month one year ago shows a similar same trend — fewer jobs, although the labor force is larger except for September.
The following chart of changes in employment from the same month of the previous year shows months when the Wichita MSA performed better than the nation before the pandemic. In all months affected by the pandemic, we see the decline in employment Wichita has not been as severe as the nation.
The following chart shows the monthly change in nonfarm jobs for Wichita and the nation. For September, the number of jobs in Wichita was unchanged, while for the nation, the number grew a small amount. For the last four months, Wichita employment has been growing at a rate slower than the national rate.
The following two charts show changes in jobs for Wichita and the nation over longer periods. The change is calculated from the same month of the previous year. For times when the Wichita line was above the nation, Wichita was growing faster than the nation. This was often the case during the decades starting in 1990 and 2000. Since 2010, however, Wichita has rarely outperformed the nation and sometimes has been far below the nation. Since the pandemic, however, Wichita has been outperforming the nation.
(For data on all metropolitan areas in the nation, see my interactive visualization Metro area employment and unemployment.)