Tag: Wichita city government

  • Wichita to consider tax forgiveness outside policy parameters

    Wichita to consider tax forgiveness outside policy parameters

    The Wichita city council will consider a tax giveaway for an economic development project that does not meet its stated policy.

    Tomorrow the Wichita City Council will consider issuing up to $33 million in Industrial Revenue Bonds in relation to a project at the Wichita State University Innovation Campus.

    Despite its name, in the IRB program the city does not purchase bonds or lend money. The city does not guarantee the payment of the bond interest or principle. Instead, the IRB program allows the city to grant tax forgiveness, both property tax and sales tax. 1 City documents explain: “MWCB is also requesting a sales tax exemption on items purchased for the project and a 100% five-year tax exemption on the IRB-financed real property improvements plus a second five-year exemption subject to City Council approval.” 2 (emphasis added)

    How much tax is being forgiven? For property tax, $773,604 annually for up to ten years, again from city documents:

    Based on the latest available mill levy, and assuming that the real property improvements are valued at 80% of the actual capital investment, the estimated value of the property tax abatement for the first full year is approximately $773,604. The value of a 100% real property tax exemption as applicable to the taxing jurisdictions is:

    City $215,767
    State $9,900
    County $193,927
    USD 259 (Wichita Public School District) $354,010

    City documents don’t estimate the amount of sales tax savings, but if all the bond proceeds were spent on taxable items, the savings would be $2,475,000.

    This project fails to meet standards set by the city and county for payback from economic development incentives. According to the city’s economic development pages, “City benefit/cost ration must be at least 1.3 to 1.” 3 This requirement is repeated in the Sedgwick County/City of Wichita Economic Development Policy: “The ratio of public benefits to public costs, each on a present value basis, should not be less than 1.3 to one for both the general and debt service funds for the City of Wichita; for Sedgwick County should not be less than 1.3 overall.” 4

    The benefit-cost ratios supplied for this project don’t meet the city and county standards, again from city documents:

    A benefit/cost analysis was performed by Wichita State University’s Center for Economic Development and Business Research based upon the proposed Letter of Intent, with the following ratio of benefits to costs:

    City of Wichita 1.18 to 1.00
    City General Fund 1.10 to 1.00
    City Debt Service 1.37 to 1.00
    Sedgwick County 1.11 to 1.00
    USD 259 1.34 to 1.00
    State of Kansas 5.08 to 1.00

    While the 1.3 to one threshold is met for the city’s debt service fund, it is not met for the city as a whole. Additionally, it doesn’t meet the 1.3 to one threshold for Sedgwick County. The Sedgwick County/City of Wichita Economic Development Policy specifies mitigating factors that can be used to bypass the 1.3 to one requirement, but city documents do not mention these.

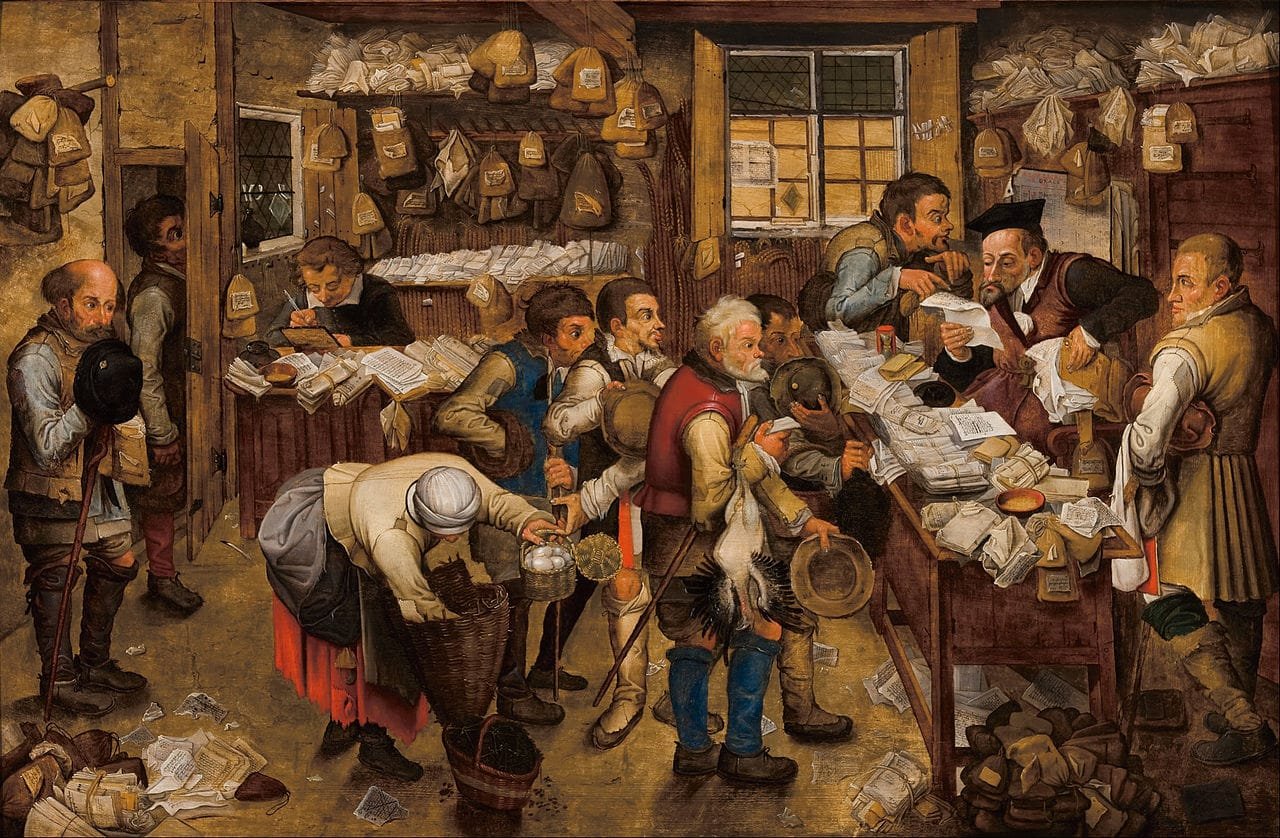
    Pieter Brueghel the Younger. The tax-collector’s office.


    Notes

  • Can Wichita learn from a setback?

    Can Wichita learn from a setback?

    What can Wichita learn from the news of layoffs at Spirit and Textron?

    While the Wichita metropolitan area is facing immediate stress due to layoffs at two large employers, we need to look at the long-term horizon and evaluate whether our economic development strategy needs adjustments.

    Like many areas, Wichita relies on economic development incentives to lure companies, or to persuade them to stay rather than leave for elsewhere. There is much research finding incentives playing a minor part in business decisions. Nathan M. Jensen, for example, found this:

    In my own study of 80 incentive offerings in Texas, published in October in the journal Public Choice, I found that numerous companies applied for incentives after they had already broken ground and, in some cases, after they had completed building. A few even noted in their applications that they weren’t looking at other states for their investments. Yet all of these companies received taxpayer dollars for doing what they would have done anyway.

    This points to the open secret of economic development: Though incentives are rarely effective in changing firms’ investment decisions, they do allow politicians to attend ribbon-cutting ceremonies where they can highlight their own role in attracting a new company (or retaining an old one) and creating jobs. 1

    Timothy J. Bartik found this: “Reviewing 34 estimates from research studies of incentives’ effects, Bartik found that typical incentives only tip 2 to 25 percent of location decisions — that is, the company wouldn’t have located there ‘but for’ the incentive.” 2

    So how can we know if incentives are needed in a particular instance? It’s difficult, as neither party has an incentive to be forthright. If a business executive does not ask for incentives, the firm’s owners are justified in asking why not. And it’s difficult for politicians and bureaucrats to turn down opportunities to bask in the glory of groundbreaking and ribbon-cutting ceremonies and their improved chances at re-election.

    Incentives increase the cost of government for those who don’t receive them. Yes, cities like Wichita promote a benefit-cost analysis that shows that for each dollar spent or forgone for incentives, the city receives even more. But this happens with all economic activity, even that which is not incentivized. This leads to the important question: Is the incentive necessary? With so much evidence showing incentives are not necessary, Wichita spends a lot on companies that don’t need incentives, with everyone else paying their cost.

    Even before the Spirit announcement, Wichita was looking at a slowly-growing economy. The Center for Economic Development and Business Research at Wichita State University provides forecasts for the Wichita economy. For 2020, CEDBR wrote in its October forecast, “For 2020, growth is expected to be more modest, as the Wichita economy is projected to add approximately 1,600 new jobs and grow 0.5 percent.” 3 For comparison, total nonfarm employment rose by 2,800 jobs (0.9 percent) from November 2018 to November 2019. For the same period, employment in the nation grew by 1.5 percent. CEDBR forecast a slowing of the growth of the Wichita economy, and that was well before the announcements of layoffs at Texron and Spirit.

    What to do?

    A Wichita Eagle editorial suggests diversifying the local economy. That’s been a goal for decades. But it hasn’t happened. 4

    The Eagle also advises “swift, decisive action,” taking “economic development off the back burner, where it’s languished for years.” This is surprising, as organizations like Greater Wichita Partnership are devoted to the task of economic development. GWP tells us, “Fast-forwarding economic growth is at the heart of the Greater Wichita Partnership’s mission. 5 The cost of employing its two top executives topped $485,000 in 2018. It also paid $115,000 to share an executive with another agency. 6 If the Eagle thinks this is practicing economic development at a slow simmer, we need to make a few big changes.

    The Eagle also calls for “generous funding streams.” This may be a reference to the common perception that Wichita has few economic development incentives available. But we have about the same as everyone else: Forgiveness of property and sales taxes, tax increment funding, refunds of employee state withholding taxes, sales tax districts, investment tax credits, historic tax credits, loans, parking easements, grants, and regulatory relief. The city says it no longer uses cash incentives, which is not true.

    The Eagle notes some bright spots, mentioning specifically, “Cargill’s decision to stay in Wichita.” But that was a decision to stay, and it came at great cost to the city.

    We need to say no to incentives for large firms.

    There’s plenty of evidence that young business firms are the key to economic growth. 7 But Wichita’s economic development policies, as evidenced by the lavishing of subsidy on Spirit and Cargill, are definitely stacked against the entrepreneur.

    These subsidies and practices are harmful to the Wichita economy, creating a strangling effect on entrepreneurship and young companies. As large subsidized companies escape paying taxes, others have to pay. This increases the burden of the cost of government on everyone else — in particular on the companies we need to nurture.

    Instead, Wichita relies on targeted investment in our future. Our elected officials and bureaucrats believe they have the ability to select which companies are worthy of public investment, and which are not. It’s a form of centralized planning by government that shapes the future direction of the Wichita economy. It hasn’t been working.


    Notes

    1. *The Amazon HQ2 Fiasco Was No Outlier.* Available at https://www.wsj.com/articles/the-amazon-hq2-fiasco-was-no-outlier-11544800749.
    2. Upjohn Institute. Available at https://www.upjohn.org/research-highlights/how-effective-are-local-economic-development-incentives.
    3. Center for Economic Development and Business Research at Wichita State University. Wichita Employment Forecast. October 3, 2019. Available at https://www.cedbr.org/content/2019/eoc/2020-wichita-forecast.pdf.
    4. Weeks, Bob. Wichita aerospace manufacturing concentration. Available at https://wichitaliberty.org/economics/wichita-aerospace-manufacturing-concentration/.
    5. https://greaterwichitapartnership.org/about_us/about_us.
    6. IRS form 990 for 2018.
    7. Jason Wiens and Chris Jackson. *The Importance of Young Firms for Economic Growth. * Available at https://www.kauffman.org/what-we-do/resources/entrepreneurship-policy-digest/the-importance-of-young-firms-for-economic-growth.
  • Wichita jobs and employment, November 2019

    Wichita jobs and employment, November 2019

    For the Wichita metropolitan area in November 2019, the labor force is up, the number of unemployed persons is down, the unemployment rate is down, and the number of people working is up when compared to the same month one year ago. Seasonal data shows small increases in labor force and jobs from October.

    Data released last week by the Bureau of Labor Statistics, part of the United States Department of Labor, shows a slowly improving employment situation for the Wichita Metropolitan Statistical Area.

    Click charts and tables for larger versions.

    Total nonfarm employment rose from 303,600 last November to 306,100 this November. That’s an increase of 2,800 jobs or 0.9 percent. (This data is not seasonally adjusted, so month-to-month comparisons are not valid.) For the same period, employment in the nation grew by 1.5 percent. The unemployment rate in November 2019 was 3.2 percent, down from 3.3 percent one year ago.

    Considering seasonally adjusted data from the household survey, the labor force rose by 634 persons (0.2 percent) in November 2019 from October 2019, the number of unemployed persons rose by 10 (0.1 percent), and the unemployment rate was 3.4 percent, unchanged from October. The number of employed persons not working on farms rose to 301,338 in November from 300,714 the prior month, an increase of 495 persons, or 0.2 percent.

    The following chart of the monthly change in labor force and employment shows the rise in employment and labor force over the last five months.

    The following chart of changes from the same month one year ago shows a decline in the rate of growth of both employment and labor force. The values are (almost all) growing, but at a slower pace each month until the last three months.

    The following chart of changes in employment from the same month of the previous year shows some months when the Wichita MSA performed better than the nation. Over the past 12 months, the average monthly job growth for the nation was 1.49 percent, and for the Wichita MSA, 0.82 percent.

    The following two charts show changes in jobs for Wichita and the nation over longer time periods. The change is calculated from the same month one year ago. For times when the Wichita line was above the nation, Wichita was growing faster than the nation. This was often the case during the decades starting in 1990 and 2000. Since 2010, however, Wichita has rarely outperformed the nation and sometimes has been far below the nation.

  • It may become more expensive in Wichita

    It may become more expensive in Wichita

    The City of Wichita plans to create a large district where extra sales tax will be charged.

    At next Tuesday’s Wichita City Council meeting, the council will consider imposing additional taxes in downtown Wichita and Delano. The new tax district includes the new baseball park and large amounts of surrounding land, some of the land in Waterwalk east of the Arkansas River, and land as far north as First and Waco.

    The new tax is known as a Community Improvement District, or CID. In these districts, merchants charge additional sales tax which is used to benefit the owners of property in the district. In this case, the city is proposing to add two cents per dollar to the existing 7.5 percent sales tax.

    City documents give this for the use of the funds: “CID revenue will be used for the design and construction of the stadium utilities, parking, and other improvements related to the stadium, river corridor improvements and surrounding development on the west bank, within the district.”

    Of note, the city proposes to pass the ordinance on emergency first reading.

    Following, a map of the CID. Click for a larger version.

  • Wichita economy grows, and a revision

    Wichita economy grows, and a revision

    The Wichita economy grew in 2018, and revised statistics show growth in 2017.

    Statistics released this month by the Bureau of Economic Analysis, an agency of the United States Department of Commerce, report real gross domestic product (GDP) figures for metropolitan areas. Also included are revised statistics for previous years.

    For 2018, the Wichita metropolitan area GDP, in real dollars, grew by 3.3 percent. Revisions to 2017 data show that Wichita GDP grew by 1.7 percent in 2017. Last year BEA reported growth for that year of -1.4 percent.

    In the statistics released this month, GDP in 2018 was $32,832,296 thousand, measured in chained 2012 dollars. In 2017 it was $31,780,917 thousand, a change of $1,051,379 thousand or 3.3 percent. For the nation, real GDP grew by 2.9 percent.

    The revision to the 2017 GDP may come as a surprise. The nearby chart shows that while GDP rose in that year, employment declined.

  • Downtown Wichita population is up

    Downtown Wichita population is up

    New Census Bureau data shows the population growing in downtown Wichita.

    Data released today by the United States Census Bureau shows the estimated population for zip code 67202 in 2018 was 1,671, an increase of 73 from the prior year.

    Zip code 67202 is greater downtown Wichita, from the Arkansas River east to Washington, and Kellogg north to Central, roughly.

    The source of this data is U.S. Census Bureau, 2014-2018 American Community Survey 5-Year Estimates. This means the data is not the Bureau’s estimate of the population in 2018. For areas of population less than 65,000, the Bureau does not provide one-year estimates. Instead, the five-year estimates use data gathered over a longer time period in order to provide greater accuracy. The 90 percent confidence interval for the 2018 estimate is plus or minus 214 persons.

    The Bureau cautions that the five-year estimates should not be used as the population of the year in the midpoint of the five-year period: “Therefore, ACS estimates based on data collected from 2011–2015 should not be labeled ‘2013,’ even though that is the midpoint of the 5-year period.” (See below for more about these data.)

    Further, the Bureau issues this advice: “However, in areas experiencing major changes over a given time period, the multiyear estimates may be quite different from the single-year estimates for any of the individual years.” Downtown Wichita, I believe, qualifies as an area “experiencing major changes.” The five-year estimates must be considered in light of this advice.

    Still, as shown in the nearby table and charts, the ACS numbers are far below the population reported by the downtown Wichita development agency Downtown Wichita. See my article Downtown Wichita population for more about this topic.

    Following, excerpts from the Census Bureau publication Understanding and Using American Community Survey Data: What All Data Users Need to Know.

    Understanding Period Estimates
    Single-year and multiyear estimates from the ACS are all “period” estimates derived from a sample collected over a period of time, as opposed to “point-in-time” estimates such as those from past decennial censuses. For example, the 2000 Census “long form” sampled the resident U.S. population as of April 1, 2000.

    While an ACS 1-year estimate includes information collected over a 12-month period, an ACS 5-year estimateincludes data collected over a 60-month period.

    In the case of ACS 1-year estimates, the period is the calendar year (e.g., the 2015 ACS covers the period from January 2015 through December 2015). In the case of ACS multiyear estimates, the period is 5 calendar years (e.g., the 2011–2015 ACS estimates cover the period from January 2011 through December 2015). Therefore, ACS estimates based on data collected from 2011–2015 should not be labeled “2013,” even though that is the midpoint of the 5-year period.

    Multiyear estimates should be labeled to indicate clearly the full period of time (e.g., “The child poverty rate in 2011–2015 was X percent.”). They do not describe any specific day, month, or year within that time period.

    Multiyear estimates require some considerations that single-year estimates do not. For example, multiyear estimates released in consecutive years consist mostly of overlapping years and shared data.

    The primary advantage of using multiyear estimates is the increased statistical reliability of the data compared with that of single-year estimates, particularly for small geographic areas and small population subgroups. Figure 3.2 shows the improved precision of an ACS 5-year estimate, compared with a 1-year estimate, for child poverty statistics in Rice County, Minnesota—a county with about 65,000 residents in 2015. The lines above and below the point estimates represent the confidence intervals, or ranges of uncertainty, around each estimate. The confidence interval for the 1-year child poverty estimate ranges from 1.4 percent to 9.4 percent (8 percentage points) while the interval for the 5-year estimate is narrower, ranging from 12.8 percent to 19.2 percent (6 percentage points). (Refer to the section on “Understanding Error and Determining Statistical Significance” for a detailed explanation of uncertainty in ACS data.)

    Deciding Which ACS Estimate to Use
    For data users interested in obtaining detailed ACS data for small geographic areas (areas with fewer than 65,000 residents), ACS 5-year estimates are the only option.

    The 5-year estimates for an area have larger samples and smaller margins of error than the 1-year estimates. However, they are less current because the larger samples include data that were collected in earlier years. The main advantage of using multiyear estimates is the increased statistical reliability for smaller geographic areas and small population groups.

    However, in areas experiencing major changes over a given time period, the multiyear estimates may be quite different from the single-year estimates for any of the individual years. The single year and multiyear estimates will not be the same because they are based on data from two different time periods.

  • Downtown Wichita jobs rise

    Downtown Wichita jobs rise

    The number of jobs in downtown Wichita rose sharply in 2017.

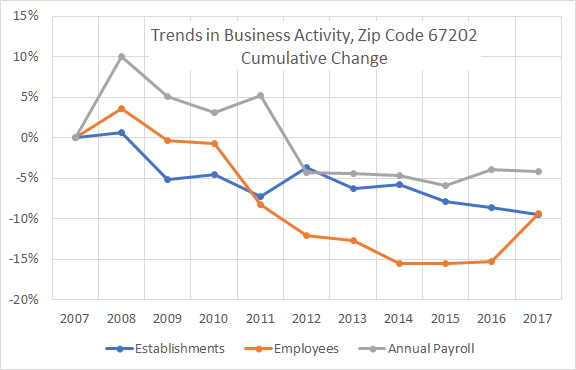
    New data from United States Census Bureau shows the number of workers in downtown Wichita rose sharply in 2017, while the number of business firms fell slightly.

    Zip code tabulation area 67202. Click for larger.

    From 2016 to 2017, the number of workers in zip code 67202 rose from 13,618 to 14,588, an increase of 970 jobs, or 7.1 percent. (Zip code 67202 is greater downtown Wichita, from the Arkansas River east to Washington, and Kellogg north to Central, roughly.)

    The number of business firms fell from 810 to 802.

    The annual payroll fell from $666,804,000 to $664,564,000, which is 0.3 percent.

    Since 2007, the number of jobs has declined by 9.3 percent, the number of business firms has declined by 9.5 percent, and annual payroll has declined by 4.2 percent.

    The significant increase in jobs in 2017 without a corresponding rise in the count of business firms is likely due in large part to the rapid expansion of two companies, King of Freight and SNT Media. The latter ceased operations in 2018.

    An interactive visualization of this data for all zip codes is available at Visualization: Zip code business patterns.


  • Wichita water plant contract

    Wichita water plant contract

    Wichita should consider discarding the water plant contract in order to salvage its reputation and respect for process.

    This week the Wichita City Council will consider approving a contract with Wichita Water Partners to build a new water treatment plant. It’s a controversial matter that likely played a significant role in the recent mayoral election. Wichita Eagle reporting by Chance Swaim in the story Wichita’s mayor steered multi-million-dollar water plant contract to friends traces through the issues.

    The most important thing is that the city receives a reliable water plant that meets its needs. Currently, the city operates a plant that is the only source of water. It’s described as having outlived its useful life. At any moment over the next several years, the city might have to spend millions to repair a plant it will retire soon.

    It’s also important that the city does not reward the corruption — petty or not — surrounding the awarding of this contract. Mayor Longwell was defeated in his bid for reelection, and that sends a message. But the other corrupt party is being rewarded, as it seems likely the city council will approve the contract with Wichita Water Partners. Its principals sought to influence the mayor by wining and dining. (Literally, they offered to deliver leftover wine to the mayor.) They flattered the mayor with honorifics like Mayor Miracle, Your Eminence, His Highness, Homecoming Queen, Eye Candy, Jethro, and Wine Delivery Guy.

    Besides this, Wichita Water Partners was not honest with the city. The Wichita Eagle reported this: “Rod Young, president of the engineering firm PEC, and Roger McClellan, president of the construction company Wildcat, both acknowledged to The Eagle their relationships with the mayor. They did not disclose those relationships to the city on a form asking about potential conflicts of interest in the water project.” (emphasis added) PEC and Wildcat are part of Wichita Water Partners.

    But the coddling of Longwell worked. After paying the mayor’s $1,000 fee to enter a charity golf tournament, Longwell told them, “I’m going to be super nice to you for a long time.” Longwell switched the basis of awarding the contract, proposing a “design competition.” But only one firm entered the competition, Wichita Water Partners. Jacobs, one of the largest engineering firms, was originally and unanimously preferred by the city’s selection committee. But the company decided not to enter the design competition. The result was only one company participating in the mayor’s “contest.”

    There are important considerations going forward, especially as the city considers spending one billion dollars or more on new projects like a convention center, performing arts center, and other downtown projects:

    • The selection committee had significant concerns regarding Wichita Water Partners and its proposal. Since the city overrode the committee’s strong recommendation, will the recommendation of other similar committees be taken seriously? Will other committees feel their job is important? What about citizen advisory boards?

    • One of the nation’s largest and most respected engineering firms declined to participate in the mayor’s “design contest.” Will the city be able to attract bids from other reputable firms given the way the water plant contract process was changed? Will future bidders fear that the city’s bid process will be changed just before the contract is awarded, after bidders have spent time and money preparing their bids?

    • While Mayor Longwell will be leaving office soon, other city officials who enabled the process — elected and others — are still in place.

    This is not the way to do business, even though the government is not a business. As the Wichita Eagle editorialized: “Longwell steered the council away from its earlier decision on how to award the water plant contract — away from competitive bidding and toward shadier ways of doing business — and that is unacceptable.”

    While Longwell was defeated in an election, the other party to the “shadier ways of doing business” won. That’s bad for the city right now, and bad for the city looking forward.

    Should the city discard the Wichita Water Partners contract this week, as is its right? Undoubtedly, starting the bid process again would add cost and cause further delay. And, given the city’s conduct, would a new bid process attract quality proposals?

    Canceling the contract and starting over is worth deliberation and consideration. Our city’s reputation and respect for process are more important than any single contract, even its largest.

  • Wichita jobs and employment, October 2019

    Wichita jobs and employment, October 2019

    For the Wichita metropolitan area in October 2019, the labor force is up, the number of unemployed persons is down, the unemployment rate is down, and the number of people working is up when compared to the same month one year ago. Seasonal data shows small increases in labor force and jobs from September.

    Data released yesterday by the Bureau of Labor Statistics, part of the United States Department of Labor, shows a slowly improving employment situation for the Wichita Metropolitan Statistical Area.

    Click charts and tables for larger versions.

    Total nonfarm employment rose from 301,800 last October to 304,600 this October. That’s an increase of 2,800 jobs, or 0.9 percent. (This data is not seasonally adjusted, so month-to-month comparisons are not valid.) For the same period, employment in the nation grew by 1.4 percent. The unemployment rate in September 2019 was 3.1 percent, down from 3.3 percent one year ago.

    Considering seasonally adjusted data from the household survey, the labor force rose by 447 persons (0.1 percent) in October 2019 from September 2019, the number of unemployed persons fell by 92 (0.9 percent), and the unemployment rate was 3.4 percent, down from 3.5 percent in September. The number of employed persons not working on farms rose to 300,758 in October from 300,219 the prior month, an increase of 539 persons, or 0.2 percent.

    The following chart of the monthly change in labor force and employment shows the rise in employment and labor force over the last two months.

    The following chart of changes from the same month one year ago a decline in the rate of growth of both employment and labor force. The values are (almost all) growing, but at a slower pace each month until this month and last.

    The following chart of changes in employment from the same month of the previous year shows some months when the Wichita MSA performed better than the nation. Over the past 12 months, the average monthly job growth for the nation was 1.40 percent, and for the Wichita MSA, 0.93 percent.

    The following two charts show changes in jobs for Wichita and the nation over longer time periods. The change is calculated from the same month one year ago. For times when the Wichita line was above the nation, Wichita was growing faster than the nation. This was often the case during the decades starting in 1990 and 2000. Since 2010, however, Wichita has rarely outperformed the nation and sometimes has been far below the nation.