Examining statements in a meme.
 A list of statements about January 6, 2021 has been widely shared on social media. Let’s take a look at a few. (Click charts and tables for larger versions.)
“Gas was $1.93 per gallon.”
According to the U.S. Energy Information Administration, in the data series “Weekly U.S. All Grades All Formulations Retail Gasoline Prices (Dollars per Gallon),” for the week ending January 11, 2021, the price was $2.403. For January 2021, the price was $2.420. The monthly average was as low as $1.938 in April 2020. (1)https://www.eia.gov/dnav/pet/hist/LeafHandler.ashx?n=pet&s=emm_epm0_pte_nus_dpg&f=m
“There was zero inflation.”
When the Bureau of Labor Statistics reported on prices for January 2021, the headline was: “The Consumer Price Index for All Urban Consumers (CPI-U) increased 0.3 percent in January on a seasonally adjusted basis, the U.S. Bureau of Labor Statistics reported today. Over the last 12 months, the all items index increased 1.4 percent before seasonal adjustment.” (2)https://www.bls.gov/news.release/archives/cpi_02102021.htm The increase for December 2020 was 0.4 percent. When expressed as a compounded annual rate, these represent inflation at 6.0 and 4.3 percent.
“Taliban wasn’t armed with U.S. artillery.”
Of all the weapons and equipment left in Afghanistan, there is no credible claim that artillery was left behind, or of artillery ever sent to Afghanistan by the United States.
“Stock market was at record-highs.”
Yes. On January 6, 2021, the Dow Jones Industrial Average was at its highest level up to that time. It has risen and fallen since then.
“Interest rates were at record-lows.”
There are many interest rates (home loan, bank prime, federal funds, etc.) but here is a commonly used series that supports the truth of low interest rates.
But other interest rates, including one that directly affects many people, is the rate on credit cards. A chart at Wallethub shows some rates higher in January 2021 than at times before.
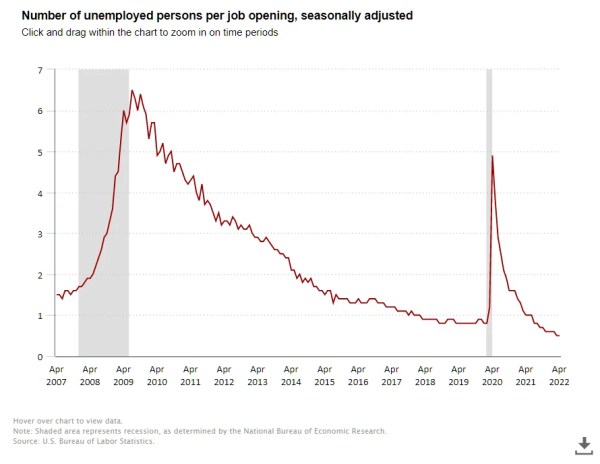
“Plenty of workers to fulfil [sic] labor needs.”
As can be seen in this chart, the number of job openings was steadily rising from the end of the 2009 recession until 2019, when it started to fall. By January 2021 it had risen to nearly its past highest value and continued to rise.
A chart from Bureau of Labor Statistics shows the ratio of unemployed persons per job opening steadily falling since the 2009 recession. By January 2021 it fell to 1.4 after nearly reaching 5 during the covid recession. The value of 1.4 was common in 2015 and 2016. (3)https://www.bls.gov/charts/job-openings-and-labor-turnover/unemp-per-job-opening.htm
“Economy was strongest in 50 yrs.”
In January 2021, the economy was struggling during the pandemic. GDP was lower, fewer people were working, and the unemployment rate was higher than before the pandemic. So the claim of a strong economy is false. The pandemic is a factor, but we have to wonder if a more effective response by the Trump administration might have mitigated the harm to the economy.
What we can do is compare the performance of the economy during the Trump presidency before the pandemic with a similar period just before Trump took office. When we do this, we find that under the Trump administration the economy mostly maintained its growth and momentum of the last years of the previous administration. That is a good accomplishment. See During the Trump administration, the economy grew and The Trump record on job creation.


