Tag: Economic development
-
Wichita WaterWalk agreement not followed
Does the City of Wichita enforce its public-private partnership agreements? In some cases the city doesn’t even ask for the information that is needed for enforcement.
-
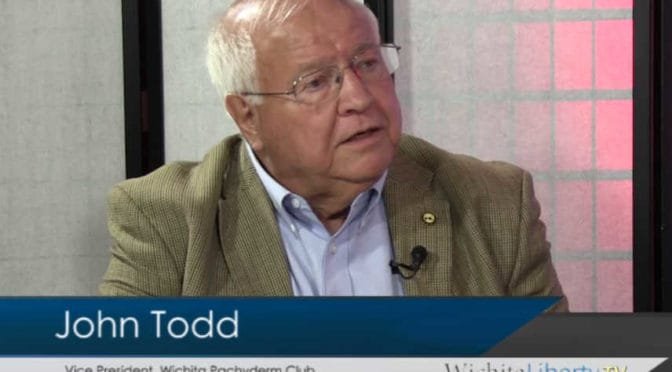
WichitaLiberty.TV: John Todd and Wichita issues
John Todd joins Bob Weeks and Karl Peterjohn to discuss issues involving the City of Wichita, including the future of Naftzger Park and economic development.
-

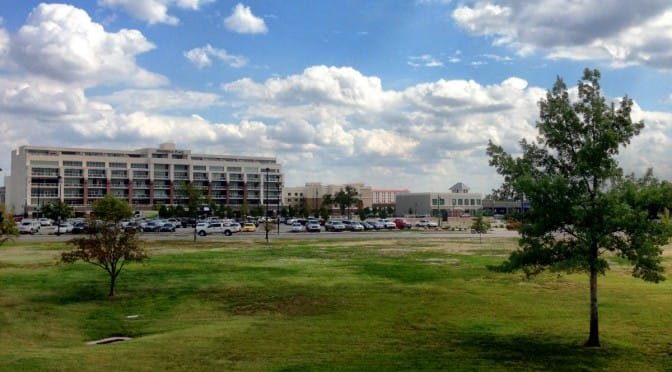
Naftzger Park in Downtown Wichita
An information resource regarding the future of Naftzger Park in downtown Wichita.
-

Wichita, Kansas, and U.S. economic dashboards
Dashboards of economic indicators for Wichita and Kansas, compared to the United States.
-

Coverage of Downtown Wichita workers
The Wichita Eagle’s coverage of the number of workers in Downtown Wichita isn’t fake news, just wrong news.
-

Metro Monitor for the Wichita economy
A research project by The Brookings Institution illustrates the performance of the Wichita-area economy.
-
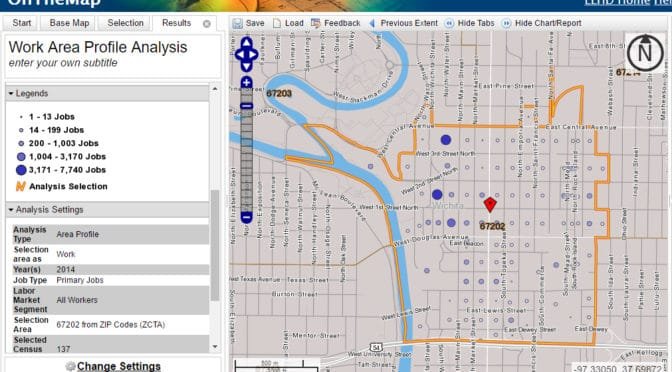
Census data for downtown Wichita workers
Is the presentation of the number of workers in downtown Wichita an innocent mistake, mere incompetence, or a willful lie?
-
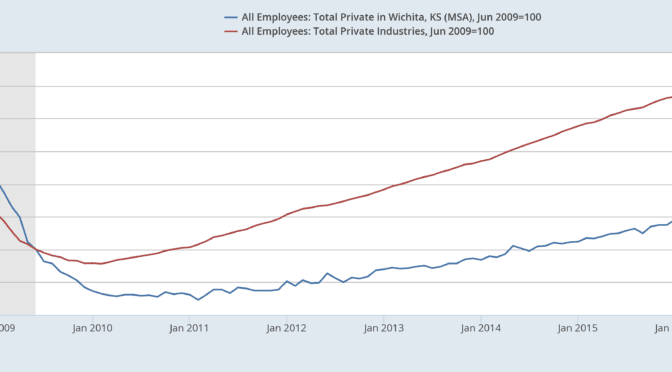
Wichita post-recession job growth
Wichita has recovered from recessions, but after the most recent, the city is falling further behind.
-

Wichita about to commit to more spending. Bigly.
This week the Wichita City Council considers hiring a consulting firm to develop plans for a new performing arts and convention center.
-
WichitaLiberty.TV Sedgwick County Commissioner Richard Ranzau
Sedgwick County Commissioner Richard Ranzau joins Bob Weeks and Karl Peterjohn to discuss current issues in Sedgwick County government.
-

On Wichita’s STAR bond promise, we’ve heard it before
Are the City of Wichita’s projections regarding subsidized development as an economic driver believable?
-
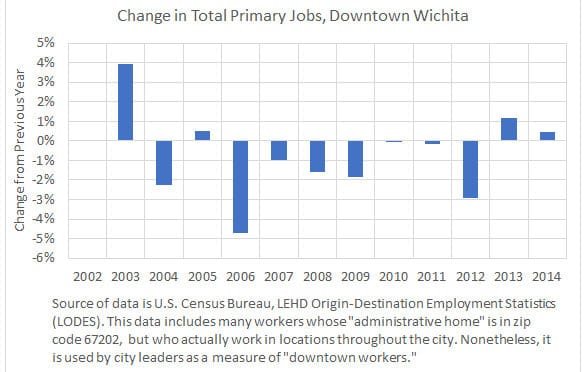
Growth in Downtown Wichita Jobs
Even if we accept the measure of jobs used by the City of Wichita, the trend is in the wrong direction. Citizens should ask for truth and accountability.