Dashboards of economic indicators for Wichita and Kansas, compared to the United States.
Example of the Wichita economic dashboard. Click to view.
The Federal Reserve Bank of St. Louis gathers economic data from sources like the U.S. Bureau of Labor Statistics and the U.S. Bureau of Economic Analysis. This data is then available in an interactive graphing and charting system.
Using this system, I’ve created dashboards (collections of charts) holding economic data for Wichita and Kansas. The images of the charts are static. Click on a chart for the current data.
At the bottom of each chart is the link “View on FRED.” By clicking on that link you gain access to the interactive version of the chart. You may then make many different types of customizations.
The Center for Economic Growth and Business Research at Wichita State University produces data and forecasts for Wichita and Kansas. It has a dedicated site for these at kansaseconomy.org. Of special interest are these data series, available as tables and charts:
The Wichita Eagle’s coverage of the number of workers in Downtown Wichita isn’t fake news, just wrong news.
A recent Wichita Eagle article reported on the number of workers in downtown Wichita, designated as zip code 67202: “The 67202 ZIP code had lost nearly 15 percent of its businesses and 20 percent of its employees in the decade ending in 2015, according to the U.S. Census’s County Business Pattern data. The loss of the State Office Building in 2016 and the Wichita school district’s downtown office this summer — employees are moving to the former Southeast High School — will make that decline steeper.” 1
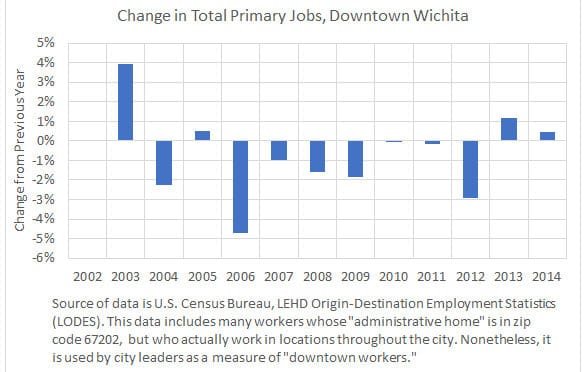
Trends of business activity in downtown Wichita. Click for larger.In the first sentence, the reporter is correct. The trend in the number of business establishments, the number of employees, and the annual payroll is downwards. 2
But the second sentence reveals a misunderstanding of the meaning of two sets of Census Bureau data. According to the Census Bureau’s description of the County Business Pattern data — that’s the data referenced in the article — the two events mentioned will not change the CBP data. That’s because governmental agencies are not included in CPB data. The Census Bureau plainly explains:
“Statistics are available on business establishments at the U.S. level and by State, County, Metropolitan area, ZIP Code, and Congressional District Levels. … CBP covers most NAICS industries excluding crop and animal production; rail transportation; National Postal Service; pension, health, welfare, and vacation funds; trusts, estates, and agency accounts; private households; and public administration. CBP also excludes most establishments reporting government employees.” 3
LODES data for census block 201730043001036, showing 7,740 workers.A second set of Census Bureau data known as LODES will change with the departure of USD 259 from zip code 67202. LODES is the source of 26,000 downtown Wichita workers claimed by Wichita State University’s Center for Economic Development and Business Research, the Wichita Downtown Development Corporation, the Greater Wichita Partnership, the City of Wichita, and other agencies. An earlier Eagle article from May 10 just scratched the surface on this topic. 4 That article described the Census Bureau data as erroneous. But there is no error in the data, as the Census Bureau plainly explains what the data means. 5 The error was in the application of the data by someone who used it to represent something it does not represent.
Readers of the Wichita Eagle may be thoroughly confused by now. Can we expect a correction or explanation? The Eagle says no.
A research project by The Brookings Institution illustrates the performance of the Wichita-area economy.
Metro Monitor from The Brookings Institution rates metropolitan areas on several indicators. For this year’s report, the most recent data included is from 2015.
For this year’s report, the news for the Wichita area is mixed. For the period 2010 to 2015, Wichita ranks 88th in growth, 69th in prosperity, and 44th in inclusion. (The 100 largest metro areas were ranked.)
Looking at just the most recent years, 2014 to 2015, Wichita ranks 73rd in growth, 42nd in prosperity, and 9th in inclusion. That’s moving in the right direction. So perhaps there is hope for progress, in that the rankings for the most recent years are better than the rankings for the past five years.
There is good news in these numbers, too. Wichita does well in most measures of “Inclusion,” which Brookings describes: “Inclusion indicators measure how the benefits of growth and prosperity in a metropolitan economy — specifically, changes in employment and income — are distributed among individuals. Inclusive growth enables more people to invest in their skills and to purchase more goods and services. Thus, inclusive growth can increase human capital and raise aggregate demand, boosting prosperity and growth.”
Wichita’s productivity ranking is good, also.
Brookings computed a measure called “Metro area competitive shift.” It’s described as “The difference between the actual job growth and the expected job growth. It indicates whether the metro area overperformed or underperformed given its industrial structure.” For the period 2010 to 2015, Wichita scored -4.2 percent. For 2014 to 2015, the measure is -0.5 percent. Again, movement in the right direction.
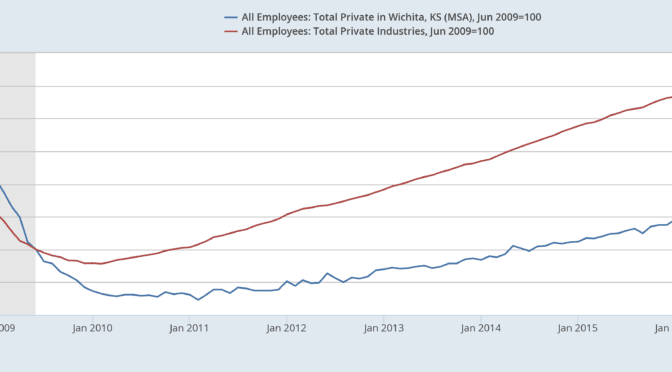
Looking at more recent data gathered from the Bureau of Labor Statistics through April 2017, we see that at a time private sector employment in the entire nation is rising steadily, in Wichita (and Kansas) employment rose at a slower rate, and has been (roughly) level since 2016.
Looking forward, the employment situation may not improve, or improve only slowly. Recently Wichita State University’s Center for Economic Growth and Business Research revised its forecast downward: “Revised employment numbers showed that Wichita’s economic growth came to a screeching halt in October of 2016. Even though employment growth presumably stopped, there is lacking evidence that the slowed employment growth is systemic. Employment growth is expected to pick up marginally, but multiple headwinds could derail that growth.” 1
Other data from BLS that I’ve charted through the Federal Reserve Bank of St. Louis show that Wichita’s unemployment rate is going down, and so is the civilian labor force. Manufacturing employment is far below previous levels, and is on a slow downward trend. You may view the Wichita dashboard here. A similar dashboard for Kansas is here.
Is the presentation of the number of workers in downtown Wichita an innocent mistake, mere incompetence, or a willful lie?
There’s a question regarding how many people work in downtown Wichita, the Wichita Eagle reports.1 Other sources have noticed a discrepancy.2
Promotional material on the former Henry’s building. Click for larger.At issue is the meaning of “working” in a certain location. Data that the Center for Economic Development and Business Research at Wichita State University supplied to the Wichita Downtown Development Corporation indicates about 26,000 people work in downtown Wichita, for these purposes defined as zip code 67202. This number is used in a wide variety of ways, including in Wichita city budgets and federal grants made by the city.
It’s appropriate, then, to understand what the 26,000 number means. The Eagle article mentions “a likely mistake in how the number of jobs downtown is calculated.”3 The same article quotes Jeremy Hill, director of CEDBR, as saying, “It looks very obvious and plausible that it is an error.”
There is no “mistake” or “error” in this Census data, which is known as LEHD Origin-Destination Employment Statistics, or LODES. But we need to be curious or cautious enough to investigate what this data means. Documentation from the Census Bureau for LODES data gives the definition of the place of work and a cautionary note: “A place of work is defined by the physical or mailing address reported by employers in the QCEW (formerly ES-202) or Multiple Worksite Reports. An address from administrative data may or may not be the actual location that a worker reports to most often.”
The Census Bureau continues with another warning regarding this data: “Nonreporting of multiple worksites is especially common with state and local governments and school districts. In such a case, LEHD infrastructure files assign all workers for that employer (within the state) to the main address provided.”4
In the case of downtown Wichita, the mistake was made in the application of this data, which is the claim that there are 26,000 workers in downtown Wichita. There may be that many people who draw a paycheck from an administrative office located in downtown. But large numbers of these don’t come to downtown to perform their jobs.
Census block 201730043001036, showing 7,740 workers.The LODES data reports a one square block in downtown that holds 7,740 workers. This is the block that holds the administrative office building for the Wichita public school district. Regarding this, the Eagle article reports: “One of the most likely reasons for the difference, according to multiple local academics, including Hill, is that the Census is reporting that every employee for USD 259 works downtown. Most USD 259 employees work in buildings across the city, but the central office is located downtown.” This is something the Census Bureau warns users to consider.
There’s another area of erroneous application, too, and it isn’t mentioned in the Eagle article. This concerns the second largest concentration of workers in downtown Wichita (according to the LODES data) in a Census block which has 3,437 employees. This is the block that holds Wichita city hall. In 2014 the city had 3,270 employees. But they don’t all work at Main and Central. They’re dispersed throughout the city in police stations, fire stations, and other sites.
How was this missed?
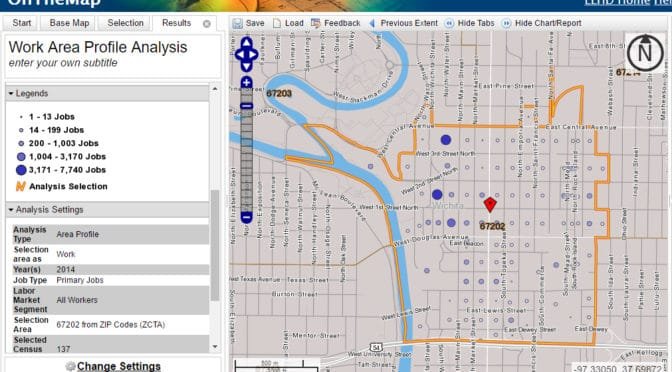
The Census Bureau OnTheMap application for downtown Wichita, zip code 67202. Click for larger.Nearby is an example of using the Census OnTheMap application.5 This is the source of LODES data that the WDDC cites in its footnotes to its annual report. When using the application for zip code 67202, there are two — and only two — large dark blue dots. These represent the census blocks with the greatest number of workers, 7,740 and 3,437. I’d like to think that if someone at CEDBR, WDDC, or city hall looked at this map and saw those two big blue dots, they might ask a few questions. Wasn’t someone curious as to how a single block of downtown Wichita manages to hold so many employees? Which companies do they work for? What can we learn from the success of these companies that employ so many people? Can we duplicate this success in other parts of downtown?
But I don’t think anyone asked these questions. No one — not at CEDBR, WDDC, or city hall — was inquisitive enough to really look at this data and see what it means. It’s either that or there was a willful misrepresentation.
The Eagle article also reports this: “This won’t make much of a difference to most businesses downtown, according to Hill. They already know how big the market is because they have experience with it. … The best companies will look at census data when coming up with their business plans, Hill said, but every business relies on several numbers, so even if there are thousands of fewer jobs downtown than previously thought, it’s unlikely that it would have much of an impact.”
On these remarks, I would say that first, we’re trying to recruit new businesses to downtown Wichita. It’s those business firms that this data speaks to. While the “best” companies may use other sources of data, I don’t think we want to discriminate. All companies are welcome to Wichita, I hope.
Second, Hill says companies “will look at census data.” Well, this is census data.
Third, Hill says this mistake won’t have “much of an impact.” In the future, I think we’ll need to ask CEDBR, WDDC, and city hall if the data they supply is intended to have an impact, or is it for something else.
Trends of business activity in downtown Wichita. Click for larger.Fourth, there is other census data. The United States Census Bureau tracks business data by zip code.6 The data that is available includes the number of business establishments, the number of employees, and the annual payroll, expressed in thousands of dollars not adjusted for inflation. It includes private-sector workers only, so it does not count all workers.
Nearby are results for zip code 67202. For 2015 the number of jobs is 13,581, not much more than half of what city leaders have told us. Again, these are private-sector workers only.7
Not only are these numbers much smaller, the results since 2007 show fewer business establishments, fewer people working downtown, and lower earnings generated in downtown Wichita. In all cases, the trend is lower. The LODES data is on a downwards trend, too.
“But the reason for this is not because 7,000 workers actually will leave but because of a likely mistake in how the number of jobs downtown is calculated. ↩
“For LODES, a place of work is defined by the physical or mailing address reported by employers in the QCEW (formerly ES-202) or Multiple Worksite Reports. An address from administrative data may or may not be the actual location that a worker reports to most often. The distinction of worksite and administrative address may be especially significant in some industries such as construction, where work is often carried out at temporary locations. In some cases, employers do not provide a multiple worksite report when it would be appropriate to do so. Nonreporting of multiple worksites is especially common with state and local governments and school districts. In such a case, LEHD infrastructure files assign all workers for that employer (within the state) to the main address provided. Bureau of Labor Statistics (BLS) data show a national noncompliance rate of 5.61 percent of multiunit employers responsible for about 4.45 percent of multiunit employment.” U.S. Census Bureau. Matthew R. Graham, Mark J. Kutzbach, and Brian McKenzie. Design comparison of LODES and ACS commuting data products. Available at ftp://ftp2.census.gov/ces/wp/2014/CES-WP-14-38.pdf. ↩
Wichita has recovered from recessions, but after the most recent, the city is falling further behind.
Since 1990 the country has experienced three recessions. For the first two of these, Wichita was able to catch up with the employment growth experienced by the entire nation.
For the most recent recession, however, this hasn’t been the case. In fact, as time progressed since 2010, the gap between Wichita and the nation has grown.
Following are three charts of private sector employment for the Wichita metro area and the nation. Each is indexed starting with the end of a recession so that job growth may be compared. Click charts for larger version. You may access and alter the chart here.
This week the Wichita City Council considers hiring a consulting firm to develop plans for a new performing arts and convention center.
Options from the City of Wichita.It’s no secret that many in Wichita want a new performing arts and convention center to replace Century II. Documents produced by the city sketch four possibilities ranging in price from $272 million to $492 million.12
The two least expensive scenarios keep the existing Century II structure, while two call for completely new buildings, including the possibility of a performing arts center located a few blocks to the east of the present Century II and proposed convention center site.
Apart from the financial desirability of these projects is the question of how to pay. The traditional approach would be for a city to build, own, and operate the project, paying for it through long-term borrowing. (Governments, including Wichita, often speak of “bonding” projects, a word which seems less foreboding than “borrowing.”)
This week’s business for the city council foreshadows the city using a different method. The firm the city wants to hire, Arup Advisory, Inc., is an advocate of “P3” or public-private partnerships. A report Arup prepared for the City of Los Angeles3 recommended that the city use a method known as Design Build Finance Operate and Maintain (DBFOM), which Arup says is used interchangeably with P3.
In the DBFOM or P3 model as applied to Wichita, a third party — thought to be George Laham — would do all the work of designing, financing, building, and operating a convention center and possibly a performing arts center. Then, the city simply pays a fee each year to use the center. It’s called an “availability payment.” Most people call this rent or lease payments.
The Los Angeles document explains the potential benefits of using DBFOM or P3:
Here, the City as asset owner hires a developer team to take on the full project development responsibility (design, build, finance, operate, maintain) and pays them an annual service fee for the availability of the functioning capital asset (i.e. infrastructure as a service). The service fee is called an “availability payment” in the P3 industry; it is a contractually scheduled pay-for-performance arrangement where the private partner is paid to design, build, and finance a turnkey capital asset and then is responsible for the operation and maintenance of the asset according to performance standards set by the City. The availability payments are fixed at the time the P3 contract is signed and are only subject to indexation to an agreed inflation index (e.g., US or Los Angeles region CPI) and deductions for non-performance against the contractually defined performance standards. The availability payments, which are the only form of compensation by the owner to the P3 developer, start only when the P3 developer has satisfied all the conditions stipulated in the contract for successful completion of construction and start of operations. These features provide substantial incentives for the P3 developer to achieve on-schedule and on-budget construction, as well as optimized life-cycle maintenance over the long term that meets the owner’s needs.
A common strategy recommended by Arup is to “cross-subsidize” with real estate. This is vaguely defined as to “unlock significant land value” in city-owned real estate near the convention center. Specific to Wichita, the proposal from Arup to the city includes, “Assess potential revenue from the monetization of city’s owned land located in proximity to the Century II facility and determine the size of the cross subsidy to the project expansion design schemes 1 and 3.”4
What are the benefits to the city of pursuing the DBFOM/P3 path? The Los Angeles document gives these: “No impact on debt capacity; significantly reduced cost to the General Fund, structured as an obligation to pay a service fee (i.e. availability payment) to the private partner where the value of the service fee is less than the sum of all the relevant LACC costs [for other options].”
To emphasize, again from the Los Angeles document: “… the City’s budgetary obligation is in the form of a service fee (i.e. availability payment) to the private partner, recorded as a contractual liability on the City’s balance sheet, as opposed to a debt obligation, which does not impact the City’s debt capacity.”
In other words, the city can make a decades-long financial committment without appearing to take on debt. Yes, the city’s committment — the “availabity payments” — will be characterized as payments that need be made only if the convention center facility is kept up to certain standards. If, not, then the city can stop paying. But then Wichita would have no cenvention center, and no performing arts center. Instead, the city would have one or two big, hulking, empty buildings in downtown.
Should Wichita do this?
Convention business is on a long downward trend. The Arup report for Los Angeles recognizes this:
Over the last two decades, most large and medium size American cities have experienced a spur in convention center development. According to the Brookings Institution (2005), exhibit hall space in the US grew from 40 million square feet in 1990 to 85 million in 2014 distributed among 400+ facilities. There is a sense in the Convention business that the supply may be exceeding demand.
A commitment of this size needs public input in the form of a vote. The “availability payments” the city may commit to will be characterized in various ways, but they represent a long-term commitment by the city that it can’t escape. If promised revenues from expanded convention trade don’t cover these payments, taxpayers will have to pay. The city, unfortunately, doesn’t have a good record of honesty with citizens:
In 2014 the city told citizens that $250 million in new sales tax revenue was required to provide drought protection. After the vote on the tax failed, the city found less expensive ways to provide the same protection.5
Subsidized city projects have not delivered promised benefits.6
The city is not truthful in reporting the number of people working in downtown Wichita.7
Despite much investment in downtown Wichita, both public and private, business activity is declining.8
Despite much investment in downtown Wichita, both public and private, total property valuation is declining.9
While touting transparency, the city fails in many basic ways, even though the city communications staff has been expanded.101112
Citizens and taxpayers should insist the city address these issues before committing to any new project, much less one the size of a renovated or new performing arts and convention center.
And — most importantly — the people need to vote up or down on this project.
Update: On May 9 the city council decided to hire this firm.
Weeks, Bob. In Wichita, the phased approach to water supply can save a bundle. In 2014 the City of Wichita recommended voters spend $250 million on a new water supply. But since voters rejected the tax to support that spending, the cost of providing adequate water has dropped, and dropped a lot. Available at https://wichitaliberty.org/wichita-government/wichita-phased-approach-water-supply-can-save-bundle/. ↩
Weeks, Bob. During Sunshine Week, here are a few things Wichita could do. The City of Wichita says it values open and transparent government, but the city lags far behind in providing information and records to citizens. Available at https://wichitaliberty.org/open-records/sunshine-week-wichita/. ↩
In this episode of WichitaLiberty.TV. Sedgwick County Commissioner Richard Ranzau joins Bob Weeks and Karl Peterjohn to discuss current issues in Sedgwick County government. View below, or click here to view at YouTube. Episode 150, broadcast May 7, 2017.
Sedgwick County to consider raising debt limit. The Sedgwick County Commission will consider raising its limit on borrowing for reasons which need to be revealed, and then carefully examined.
Tax rates in the city of Wichita:
City of Wichita 32 mills (27 percent of total)
Sedgwick County 29 mills (25 percent)
School district 54 mills (46 percent)
State 21.5 mills (18 percent)
Total 117 mills
Are the City of Wichita’s projections regarding subsidized development as an economic driver believable?
Map of STAR bond districts. Click for larger.This week the Wichita City Council will consider a project plan for a STAR bonds district near Downtown Wichita. These bonds divert future incremental sales tax revenue to pay for various things within the district.1
City documents promise this: “The City plans to substantially rehabilitate or replace Lawrence Dumont Stadium as a modern multi-sport stadium as part of a larger project to develop the river and stadium areas. … Combined, the museum, pedestrian bridge, waterfront improvements and multi-sport stadium will generate significant new visitor tourism as well as provide signature quality of life amenities for the citizens of Wichita and the region.”2
We’ve heard things like this before. Each “opportunity” for the public to invest in downtown Wichita is accompanied by grand promises. But actual progress is difficult to achieve, as evidenced by the lack of progress in Block One.3
Trends of business activity in downtown Wichita. Click for larger.In fact, change in Downtown Wichita — if we’re measuring the count of business firms, jobs, and payroll — is in the wrong direction, despite public and private investment.4
Perhaps more pertinent to a sports facility as an economic growth driver is the Intrust Bank Arena. Five years ago the Wichita Eagle noted the lack of growth in the area.5 Since then, not much has changed. The area surrounding the arena is largely vacant. Except for Commerce Street, that is, and the businesses located there don’t want to pay their share of property taxes.6
I’m sure the city will remind us that the arena was a Sedgwick County project, not a city project, as if that makes a difference. Also, the poor economic performance cited above is for Downtown Wichita as delineated by zip code 67202, while the proposed STAR bond project lies just outside that area, as if that makes a difference.
By the way, this STAR bonds district is an expansion of an existing district which contains the WaterWalk development. That development has languished, with acres of land having been available for development for many years.
“Ten years ago, Elizabeth Stevenson looked out at the neighborhood where a downtown arena would soon be built and told an Eagle reporter that one day it could be the ‘Paris of the Midwest.’ What she and many others envisioned was a pedestrian and bike-friendly neighborhood of quaint shops, chic eateries and an active arts district, supported by tens of thousands of visitors who would be coming downtown for sporting events and concerts. It hasn’t exactly turned out that way. Today, five years after the opening of the Intrust Bank Arena, most of the immediate neighborhood looks much like it did in 2004 when Stevenson was interviewed in The Eagle. With the exception of a small artists’ colony along Commerce Street, it’s still the same mix of light industrial businesses interspersed with numerous boarded-up buildings and vacant lots, dotted with ‘for sale’ and ‘for lease’ signs.” Lefler, Dion. 5 years after Intrust Bank Arena opens, little surrounding development has followed.Wichita Eagle. December 20, 2014. Available at http://www.kansas.com/news/local/article4743402.html. ↩
Even if we accept the measure of jobs used by the City of Wichita, the trend is in the wrong direction. Citizens should ask for truth and accountability.
Click for larger.Click for larger.Click for larger.The City of Wichita and its surrogates tell us there are 26,000 daytime workers in downtown Wichita, defined as zip code 67202. There is a serious problem with that number, as it includes workers whose “administrative home” is downtown, even though they work somewhere else.1 The largest example of this is the counting of all Wichita school district employees as downtown workers, even though almost all work in schools and other locations throughout the city.
But even if we use the statistic promoted by the Wichita Downtown Development Corporation, the trend in jobs is in the wrong direction. WDDC promotes the large investment in downtown Wichita, by both private and public sources. But employment is trending in the opposite direction.
As Wichita considers other large downtown investments, such as STAR bond financing for the west bank of the Arkansas River or a new convention center and performing arts center, we should ask at least two questions:
Can we depend on the city to use meaningful and truthful data?
Will the city recognize the lackluster results of its economic development efforts?
Shouldn’t we insist on progress in projects like Block One before proceeding elsewhere?2


 For this year’s report, the news for the Wichita area is mixed. For the period 2010 to 2015, Wichita ranks 88th in growth, 69th in prosperity, and 44th in inclusion. (The 100 largest metro areas were ranked.)