Tag: Visualizations
-
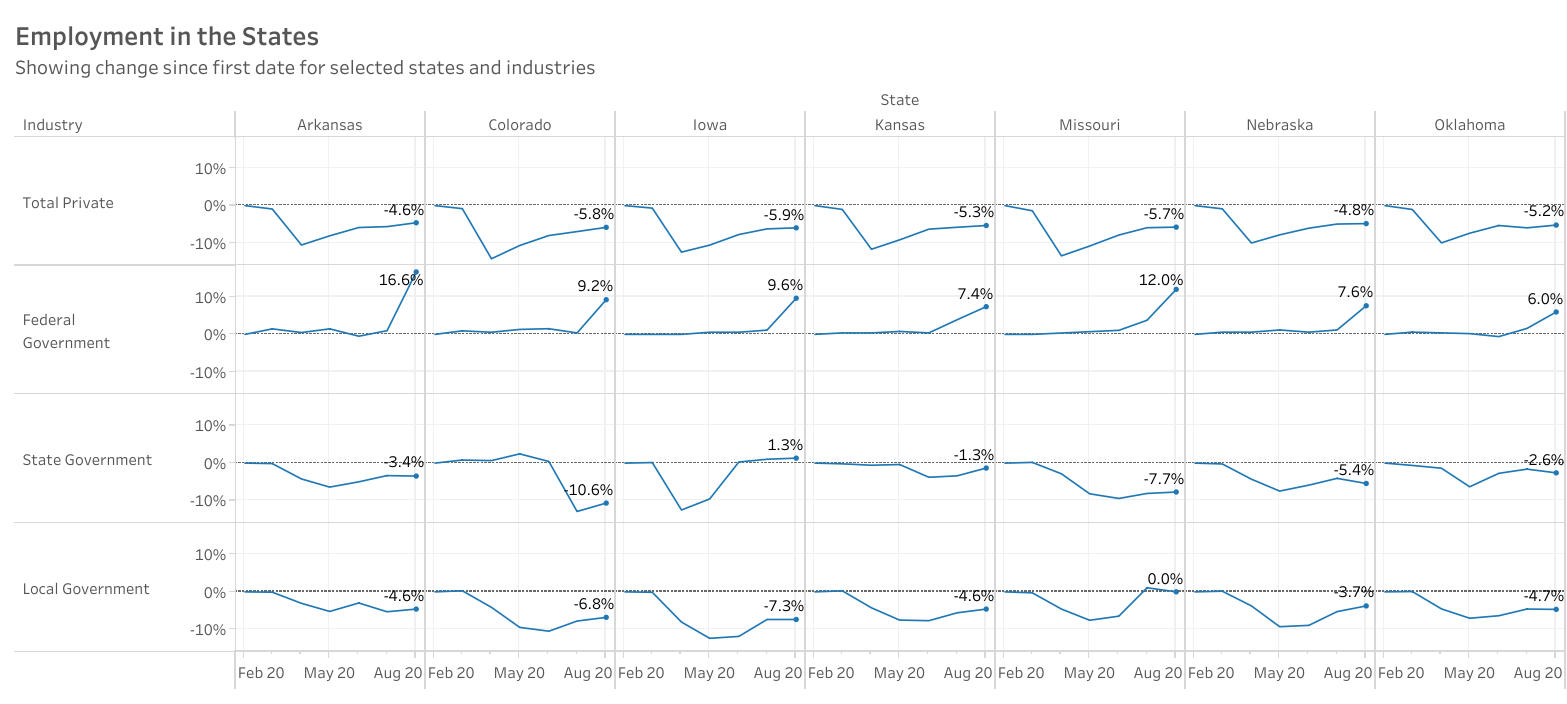
Updated: Effects of pandemic on employment in states
The effects of the response to the pandemic vary widely among the states, but federal government employment has been little affected.
-

Updated: Presidential data explorer
Explore the economic record of presidents through the lens of data, with new updates for August.
-

Kansas tax revenue, August 2020
For August 2020, total Kansas tax revenue fell by 43 percent from July, reflecting the tax deadline postponement from April to July.
-

Updated: Economic indicators in the states
Economic indicators in the states, an interactive visualization.
-

Added to presidential data explorer: Economic indexes
Explore the economic record of presidents through the lens of two economic indexes.
-
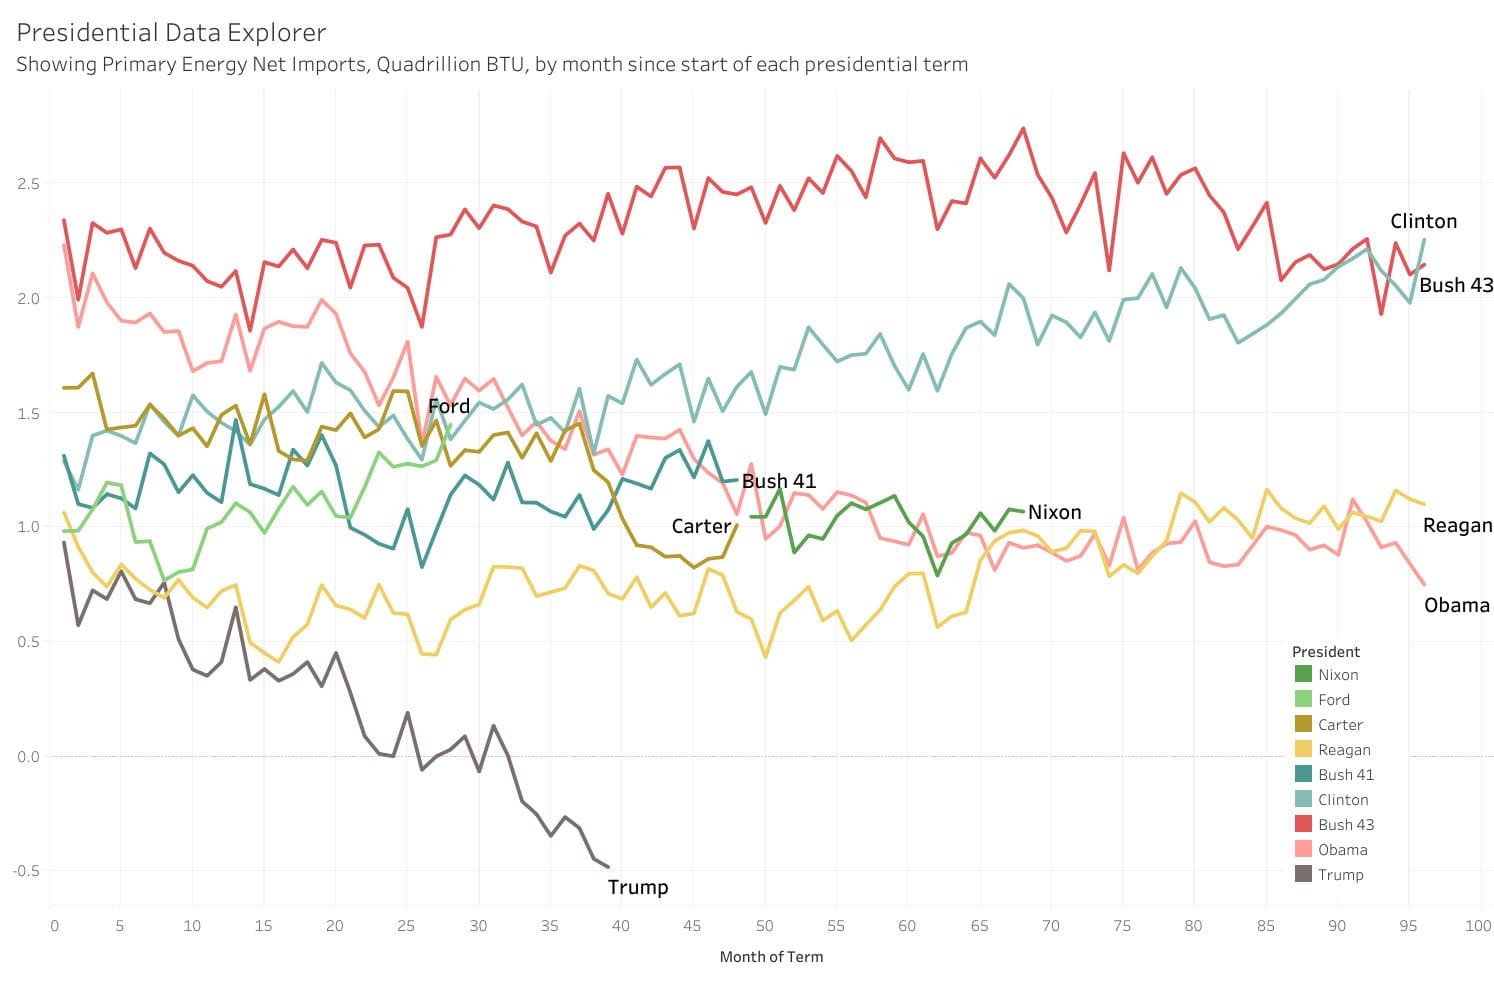
Added to presidential data explorer: Primary Energy Net Imports
Explore the economic record of presidents through the lens of energy independence.
-
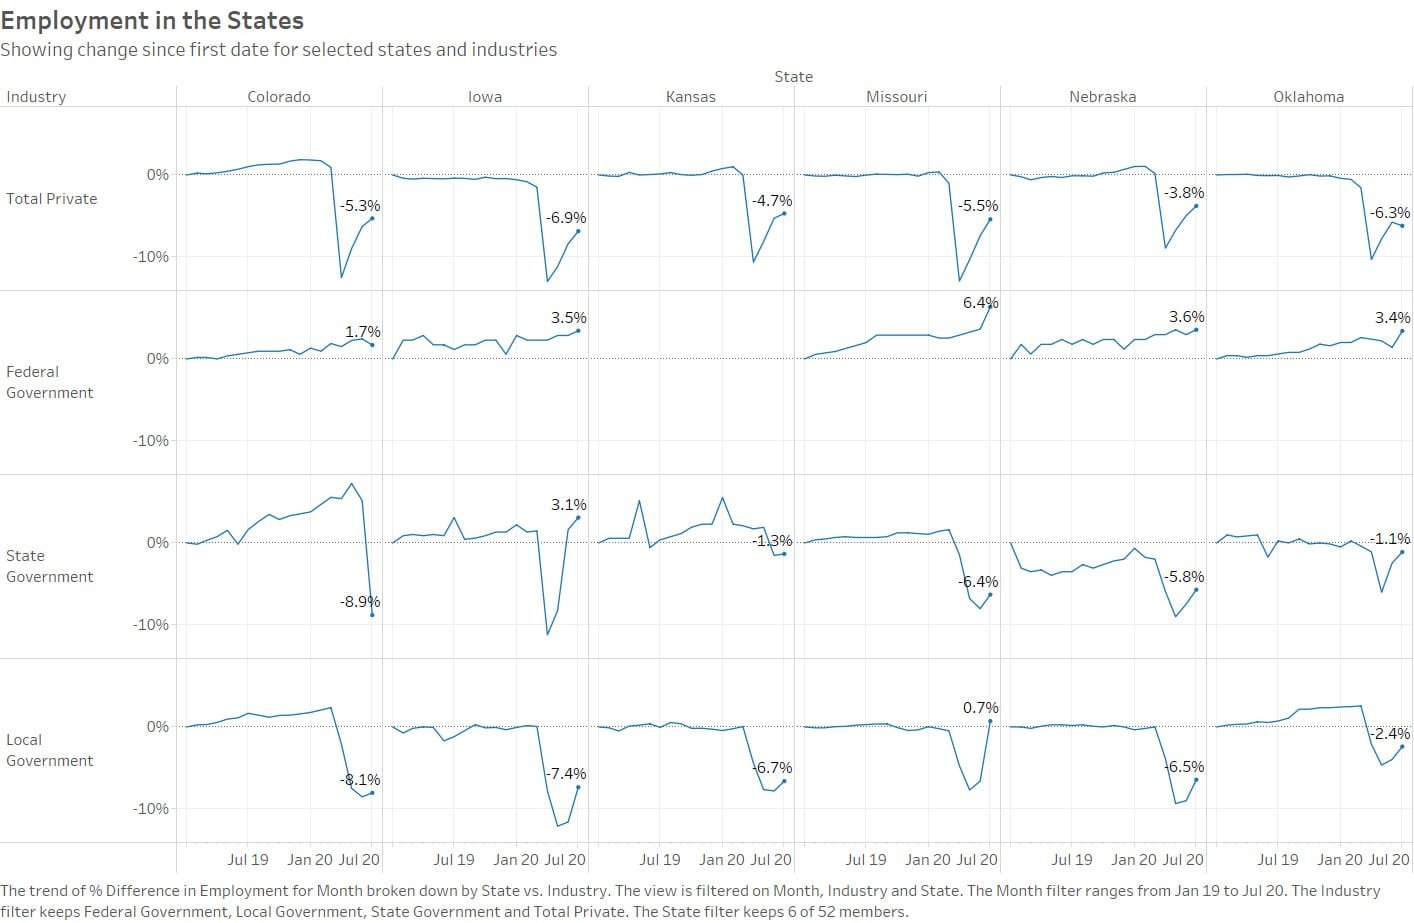
Updated: Effects of pandemic on employment in states
The effects of the response to the pandemic vary widely among the states, but federal government employment has been little affected.
-
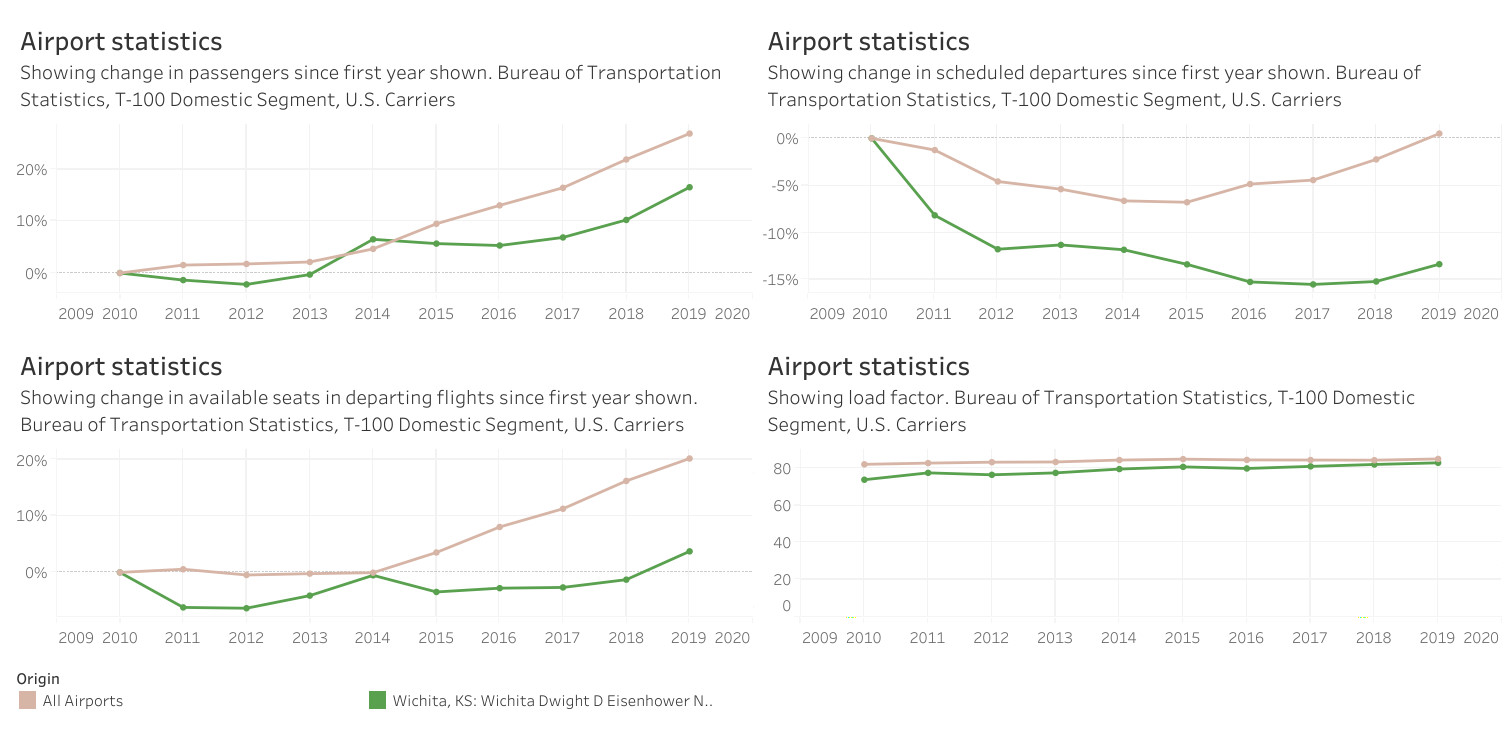
Airport traffic statistics, 2019
Airport traffic data presented in an interactive visualization, updated through 2019.
-

Added to presidential data explorer: Mortgage rates
Explore the economic record of presidents through the lens of mortgage interest rates.
-
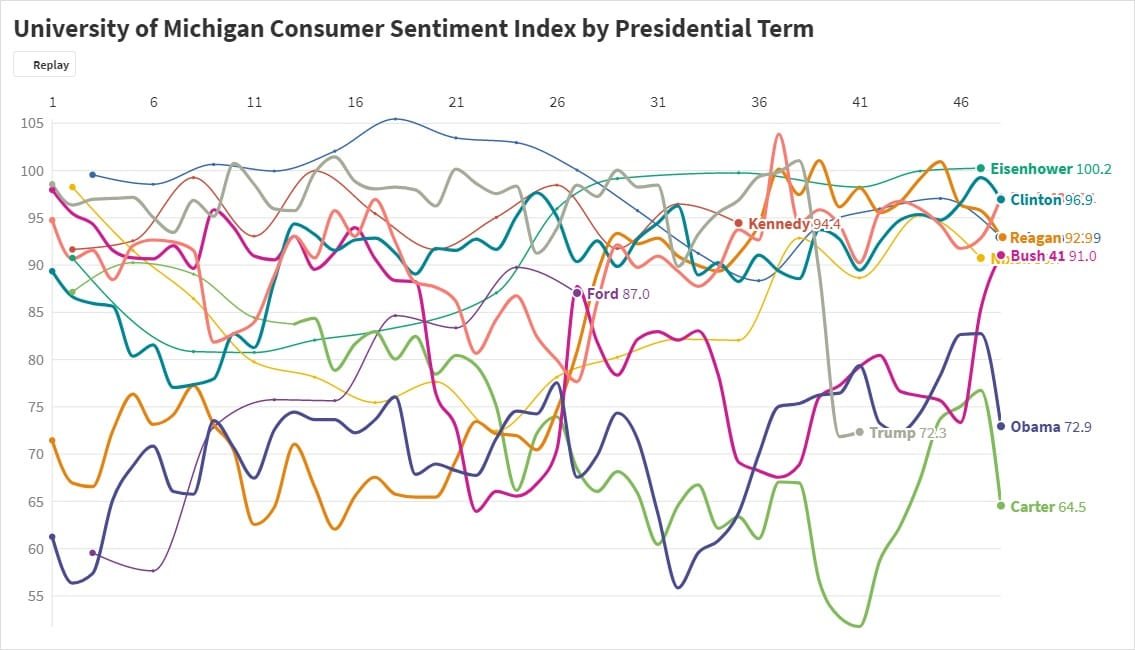
Consumer sentiment index by presidential term
For many years the University of Michigan as published a survey of consumers, with one output being a consumer sentiment index.
-
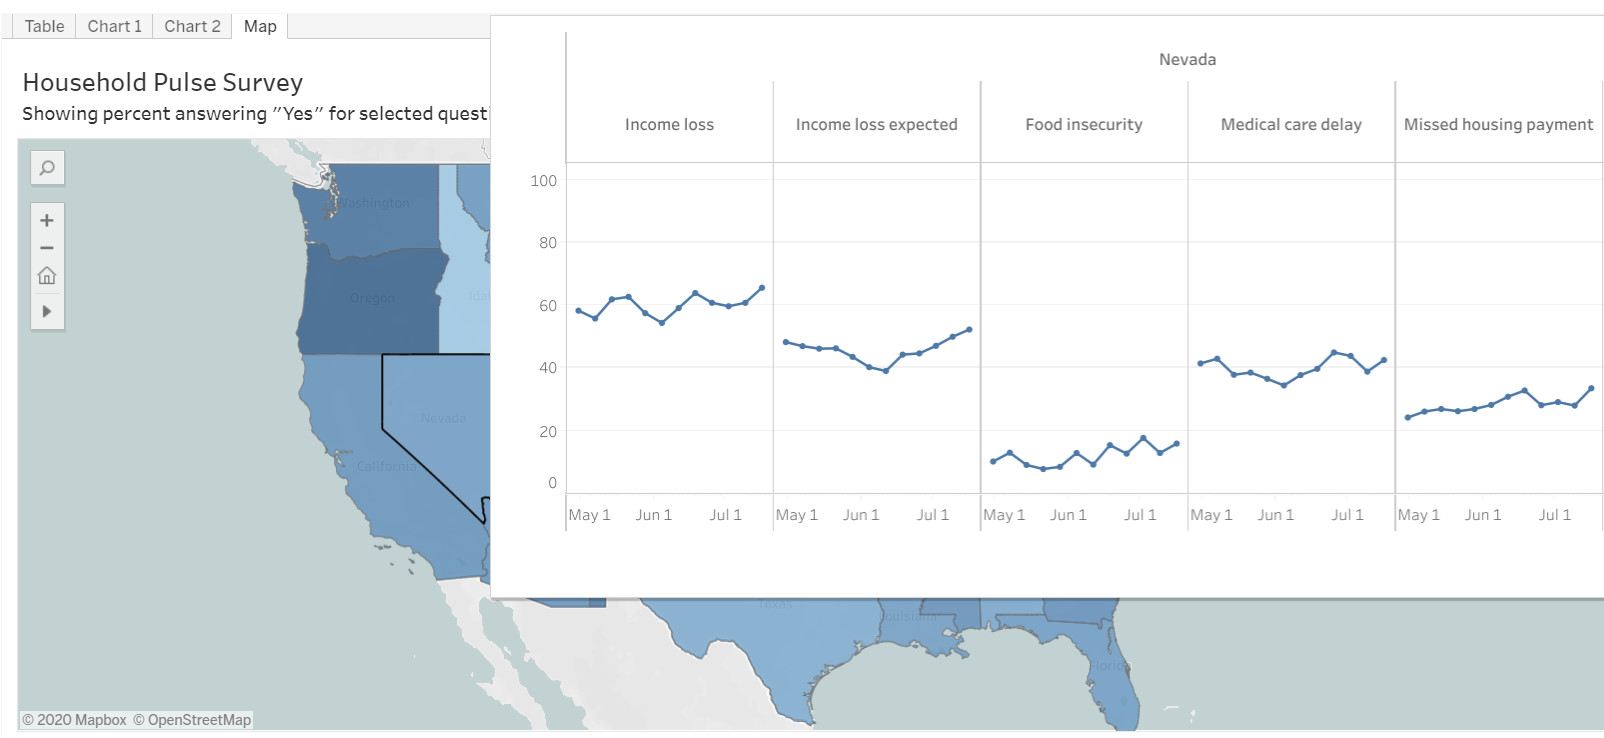
Updated: Measuring household experiences during the coronavirus (COVID-19) pandemic
An updated interactive visualization of household data on the effects of the pandemic.
-
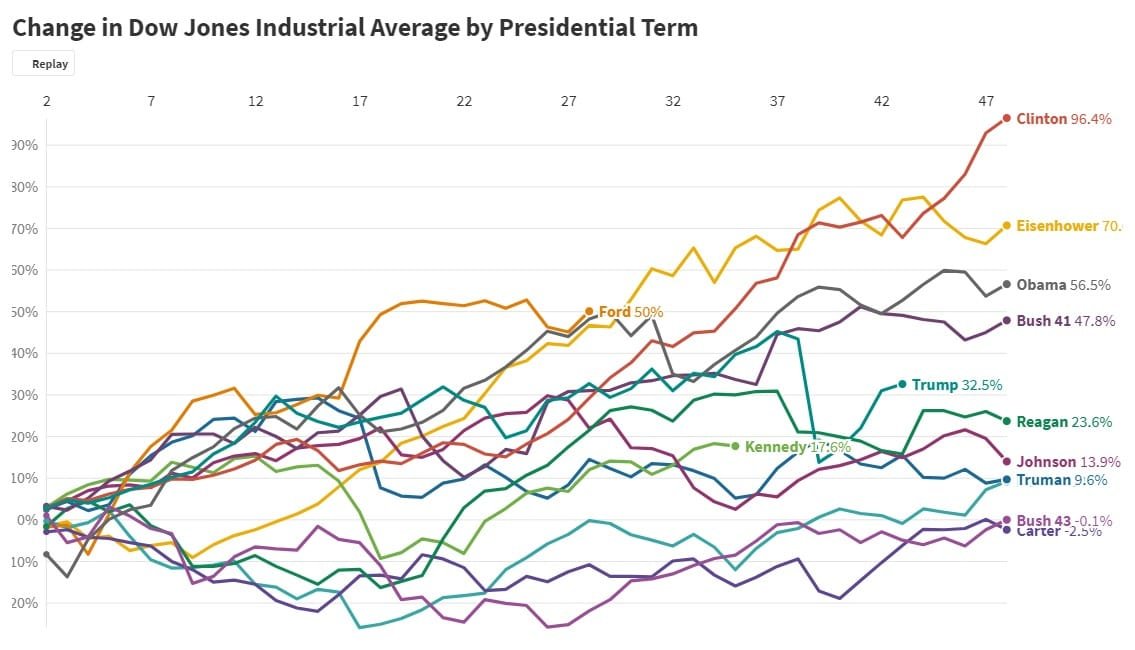
Dow Jones by presidential term
An animated chart of the Dow Jones Industrial Average for each month of a presidential term.