Following are visualizations of data. Many are interactive and created using Tableau Public. In some cases I’ve recorded myself using the visualization to tell a story, and all you have to do is watch.
Monthly retail sales by state and major retail sector, in an interactive visualization.
The United States Census Bureau has released a new experimental data product reporting monthly retail sales at the state level for major retail sectors. I’ve gathered the data and created an interactive visualization.
The data is supplied as percent change from the same month one year prior. It does not include non-store retailers.
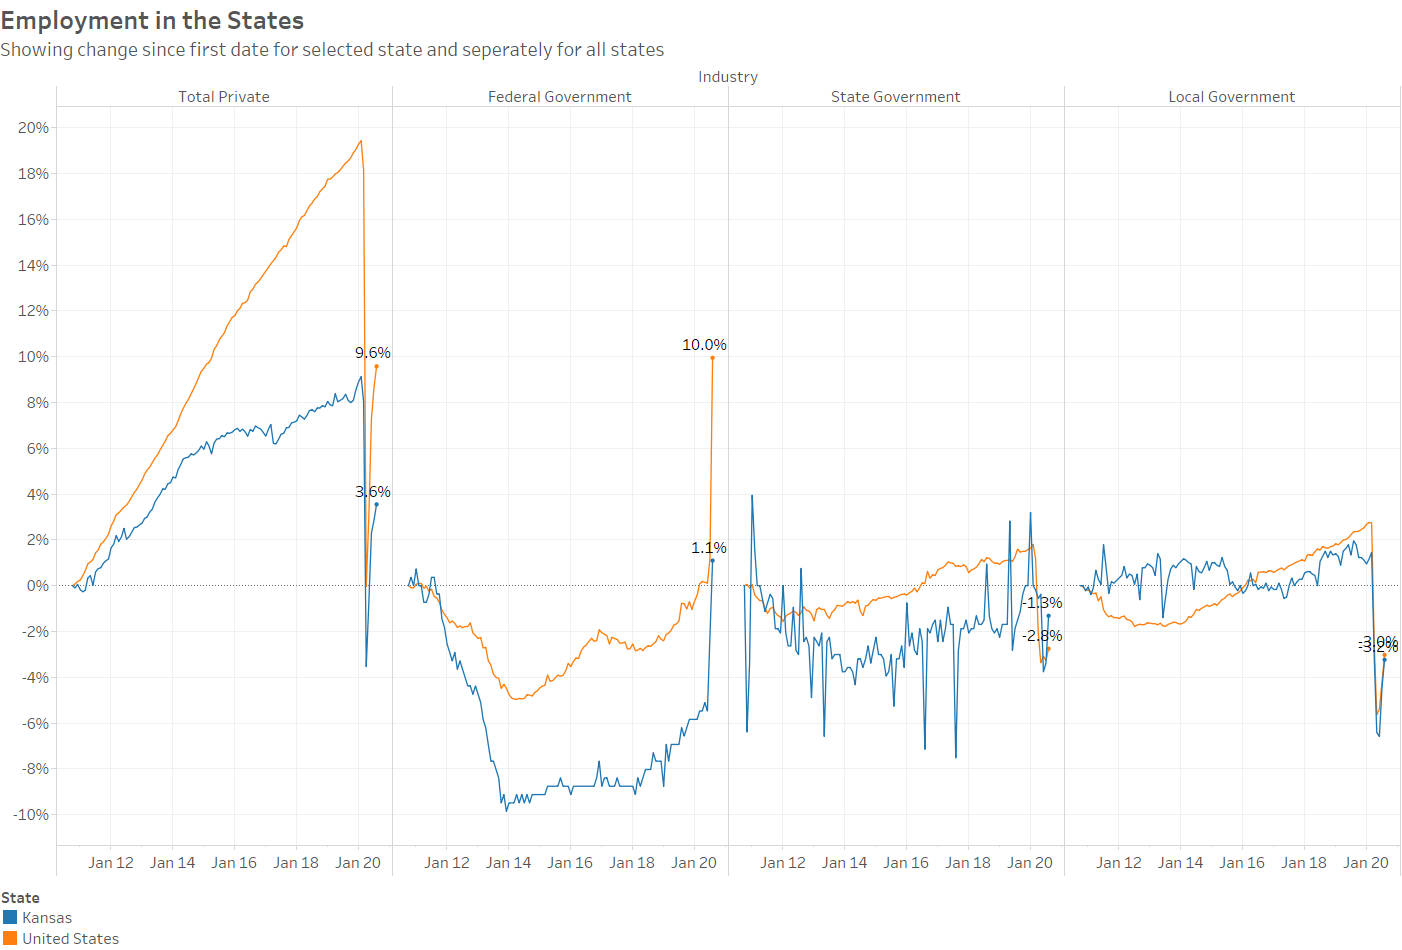
In the charts, you can easily observe the sharp drop in most retail sectors in the spring. In this example from chart 4, comparing Kansas to the nation, we can see that Kansas has fared better.
To learn more about the data and access the interactive visualization, click here.
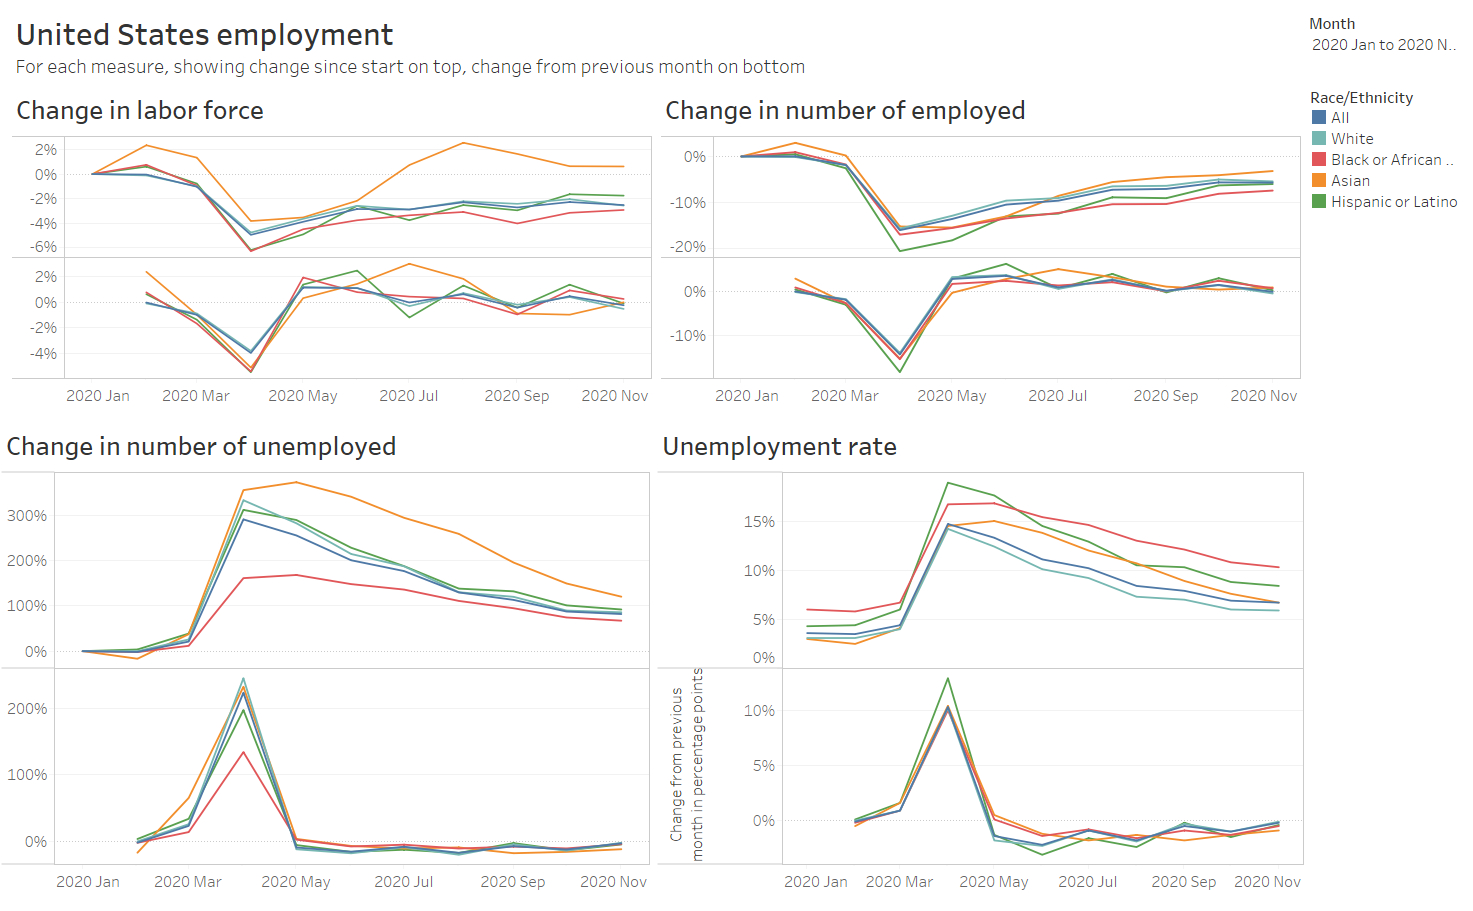
Total nonfarm payroll employment rose by 245,000 in November, and the unemployment rate edged down to 6.7 percent, the U.S. Bureau of Labor Statistics reported today. These improvements in the labor market reflect the continued resumption of economic activity that had been curtailed due to the coronavirus (COVID-19) pandemic and efforts to contain it. However, the pace of improvement in the labor market has moderated in recent months. In November, notable job gains occurred in transportation and warehousing, professional and business services, and health care. Employment declined in government and retail trade.
The decline in government employment is mostly due to the winding down of the decennial census: “A decline of 86,000 in federal government employment reflected the loss of 93,000 temporary workers who had been hired for the 2020 Census.”
An excerpt from my interactive visualization shows the rate of employment change from the previous month declining.
Employment, change from previous month. Click for larger.
To learn more about the data and access the visualization, click here. The archived version of the release for this month from BLS is here.
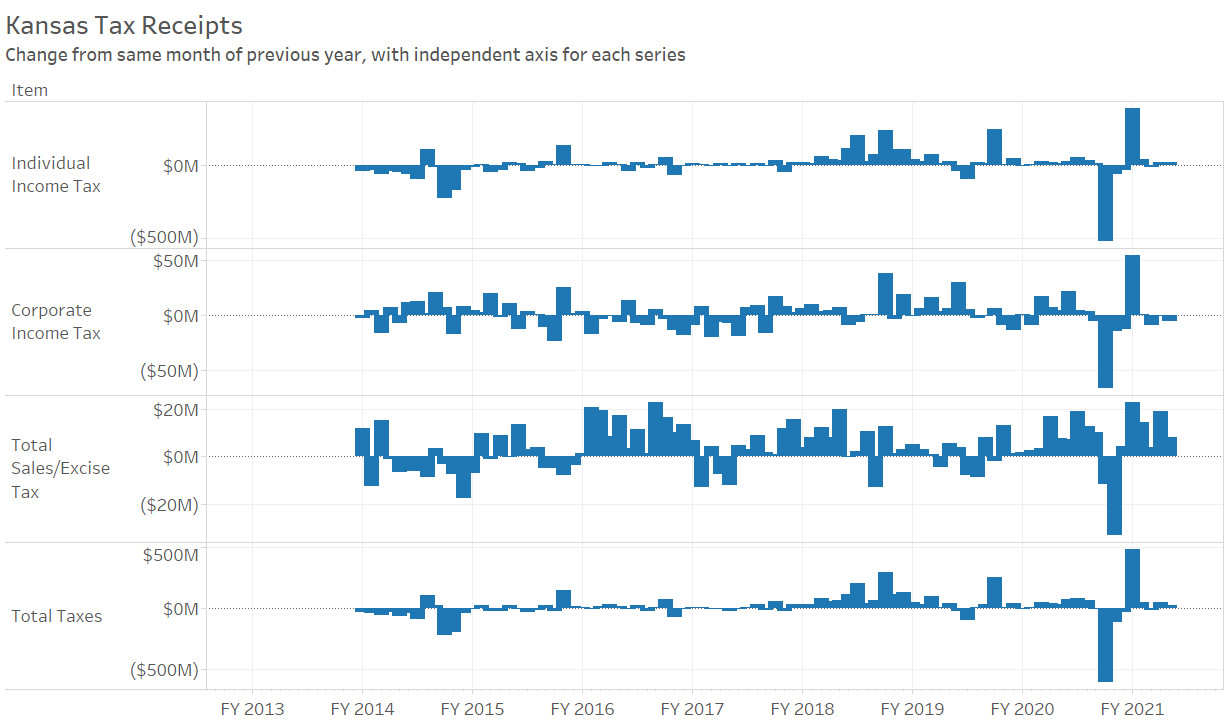
For November 2020, total Kansas tax revenue was 4.3 percent greater than last November. Over the five months of the current fiscal year, tax revenue rose by 20.6 percent.
Tax reports from the State of Kansas for November 2020 show tax revenues falling from the previous month, but higher than the same month last year, despite the effects of the response to the pandemic.
When reporting on Kansas tax collections, the comparison is usually made to the estimated collections. Those estimates were revised in April based on economic conditions affected by the response to the pandemic. To get a feel for the effects of the response to the pandemic, it is best to compare to the same month the prior year.
(The estimated revenue figures are still important because the state budget is based on them. If the actual revenue is much below the estimated revenue, there may not be enough income to pay expenses.)
For November 2020, individual income tax collections were $275,431,758, up 9.1 percent from last November. Retail sales tax collections rose by 0.1 percent to $201,705,376. Total tax collections were $556,754,532, up 4.3 percent from the same month last year. A nearby table summarizes.
For fiscal year 2021, which started on July 1, 2020, total tax collections are up by 20.6 percent over the same period of the previous fiscal year. A large reason for this is the change in tax deadlines from April to July, shifting much revenue from fiscal year 2020 to fiscal year 2021. That hasn’t always been explained, as I show in In Kansas, explanations for tax collections may vary.
As can be seen in a nearby table, tax revenue for fiscal year 2021 is $582,301,471 greater than at the same time in the previous fiscal year. Of this, $465,061,221, or 79.9 percent, is due to the increase in individual income tax revenue.
My interactive visualization of Kansas tax revenue has been updated with October data. Click here to use it.
An example from the visualization illustrates the composition of Kansas tax revenue for the last year. Individual income tax accounted for 50.5 percent of revenue, and retail sales tax 31.5 percent. Together, this is 82.0 percent. Add compensating use tax of 7.0 percent and corporate income tax of 5.6 percent, and that is nearly all — 94.6 percent — of Kansas tax revenue.
For October 2020, total Kansas tax revenue was 7.9 percent greater than last October. Over the four months of the current fiscal year, tax revenue rose by 24.4 percent.
Tax reports from the State of Kansas for October 2020 show tax revenues falling from the previous month, but higher than the same month last year, despite the effects of the response to the pandemic.
When reporting on Kansas tax collections, the comparison is usually made to the estimated collections. Those estimates were revised in April based on economic conditions affected by the response to the pandemic. To get a feel for the effects of the response to the pandemic, it is best to compare to the same month the prior year.
(The estimated revenue figures are still important because the state budget is based on them. If the actual revenue is much below the estimated revenue, there may not be enough income to pay expenses.)
For October 2020, individual income tax collections were $283,620,667, up 9.1 percent from last October. Retail sales tax collections rose by 5.1 percent to $210,994,242. Total tax collections were $596,567,392, up 7.9 percent from the same month last year. A nearby table summarizes.
For fiscal year 2021, which started July 1, 2020, total tax collections are up by 24.4 percent over the same period of the previous fiscal year. A large reason for this is the change in tax deadlines from April to July, shifting much revenue from fiscal year 2020 to fiscal year 2021. That hasn’t always been explained, as I show in In Kansas, explanations for tax collections may vary.