Following are visualizations of data. Many are interactive and created using Tableau Public. In some cases I’ve recorded myself using the visualization to tell a story, and all you have to do is watch.
I’ve gathered data from BLS and present it in an interactive visualization with tables, charts, and a map. This monthly data is from 1990 to May 2020, which is the last month for which BLS has produced data for metropolitan areas. Click here to learn more and use the visualization. Below is an example from the visualization.
An interactive visualization of monthly employment in the states by major industry category.
The Bureau of Labor Statistics, part of the United States Department of Labor, gathers data about people and jobs. I’ve gathered some of its data on monthly employment levels in the states and present it in an interactive visualization.
The data in this visualization is from the Current Employment Statistics (CES) program. BLS describes it as “a monthly survey conducted by the Bureau of Labor Statistics. It is a federal and state cooperative program that provides employment, hours, and earnings estimates for states and metropolitan areas based on payroll records of business establishments.” 1 For more information about this data and to access the visualization, click on Visualization: Employment in the states.
The visualization has a table of figures and several charts that show the relative growth of jobs over time. For most charts, you may select the time span, industry category, and states.
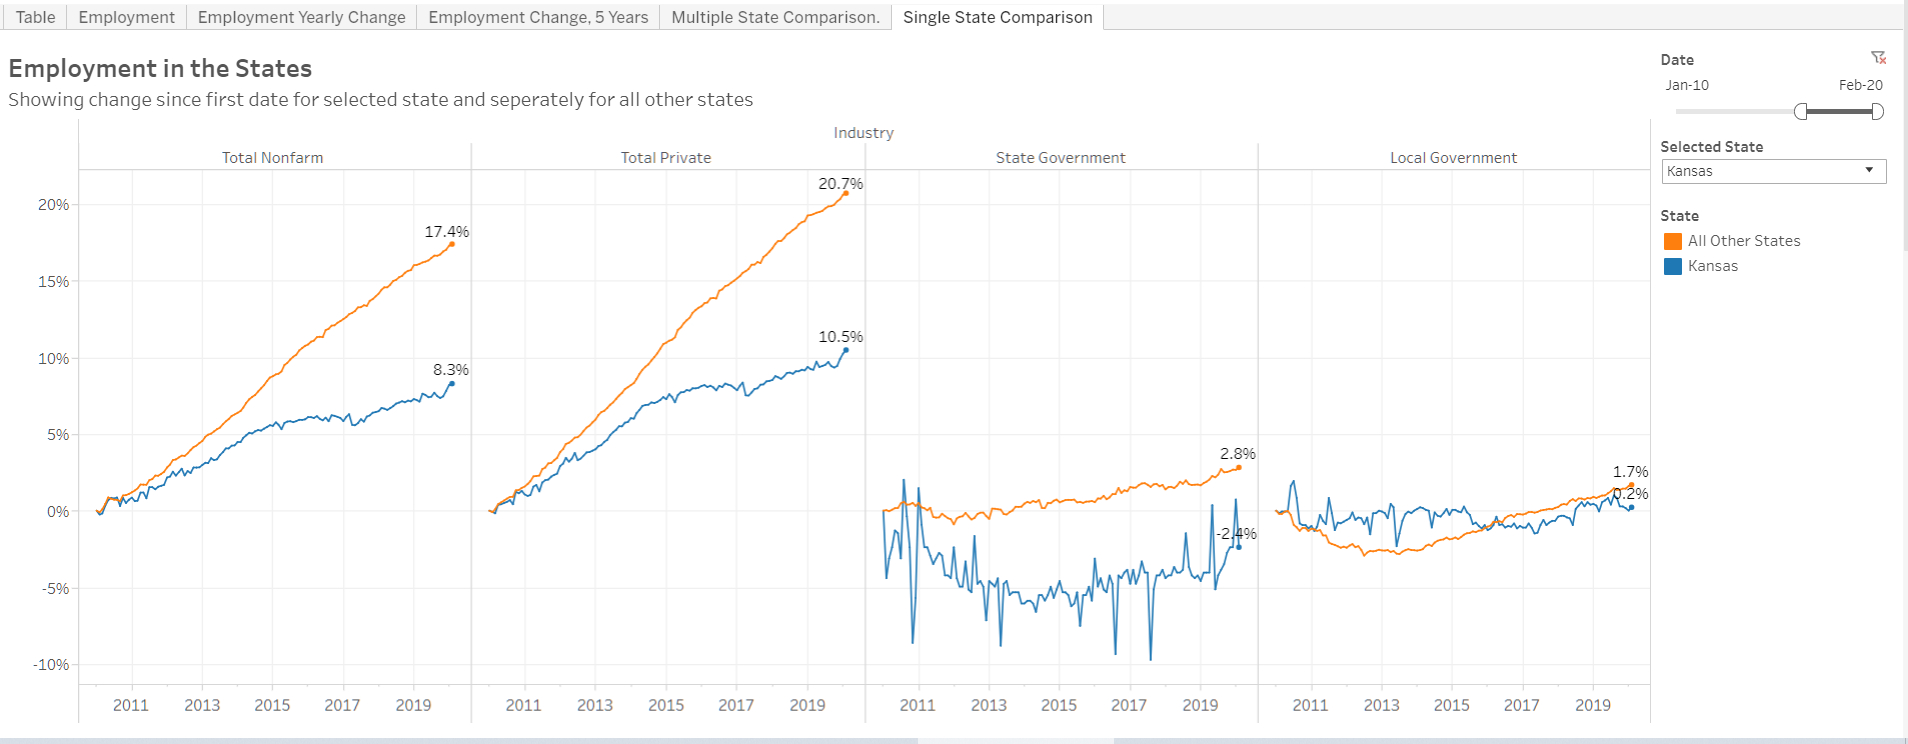
One chart, titled “Single State Comparison,” lets you select one state. It then plots that state as one line, and all other states as another line. The nearby example shows this chart with Kansas as the selected state, with data starting in 2010 and ending this February, the last month before the response to the pandemic significantly affected jobs in the United States.
In this chart, you can see Kansas lagging far behind the nation in nonfarm and private-sector employment growth. For state government employees, the trend was downward in the first portion of the last decade, but the trend is rising. Local government employment changed very little.
Example from the visualization. Click for larger.
In another chart showing the growth of nonfarm employment over time, Kansas lags behind in comparison to some nearby states.
Salary data presented in an interactive visualization by occupation and by metropolitan area. Updated with data through 2019, and with additional data and charts.
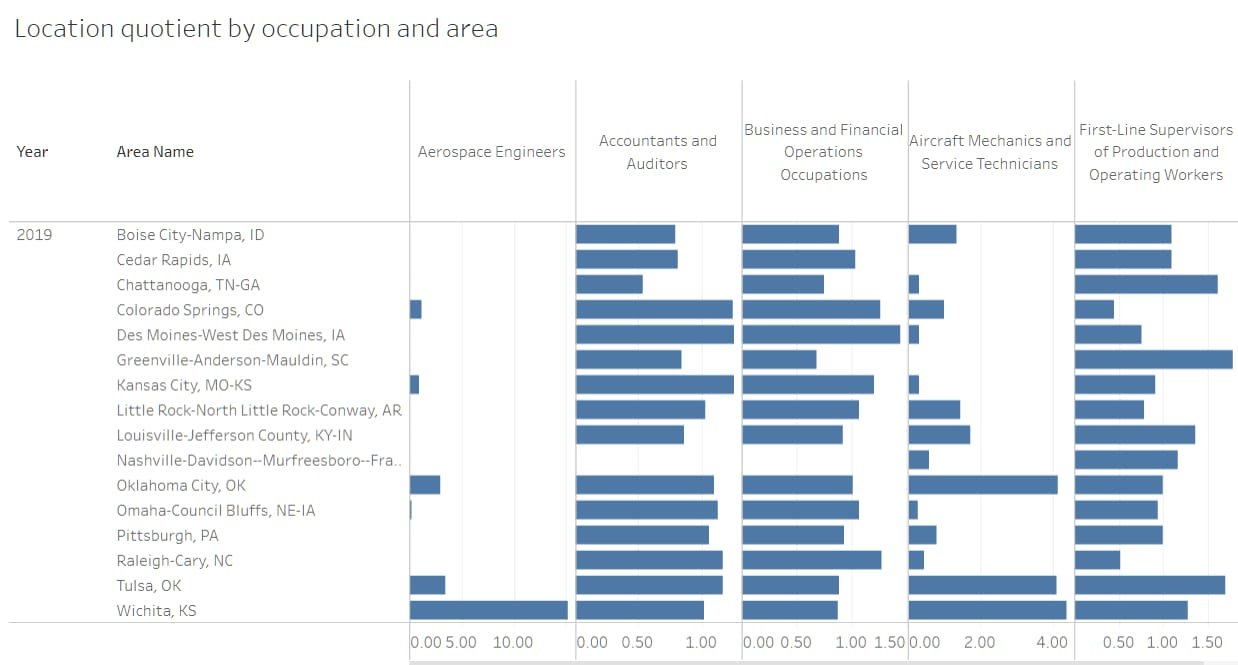
This article provides a larger explanation of the data and holds the link to the visualization itself. Here, I show some data for Wichita and a few surrounding areas for an occupation important to Wichita: Aerospace engineers.
Click for larger.
You can see that Wichita has the highest number of employees in this category, with Omaha the lowest.
“Jobs per 1000” is the number of jobs in the occupation per thousand jobs in the area. For Wichita, this number is high, and for Omaha, low.
“Location quotient” is a measure of concentration. BLS says: “As measured here, a location quotient shows the occupation’s share of an area’s employment relative to the national average. … For example, a location quotient of 2.0 indicates that an occupation accounts for twice the share of employment in the area than it does nationally, and a location quotient of 0.5 indicates the area’s share of employment in the occupation is half the national share.”
As an example, the location quotient for aerospace engineers in Wichita is 15.14. This is a relatively high value, which is not surprising given the concentration of that industry in Wichita. For Omaha, the value is low at 0.11. Of note, the location quotient for Oklahoma City and Tulsa are greater than one, reflecting the active aerospace industry in those cities.
For salary, BLS reports the mean and median, although this example shows only the mean. I rank the areas by salary and then calculate the difference for each city from the highest city. Here, Wichita ranks third in salary, with the mean being $27,380 (20 percent) less than the highest. Note that the number of aerospace engineers in Omaha is small compared to Wichita. For mechanical engineers, where the concentration between these two cities is not as large, Wichita engineers earn more.
In the interactive visualization I created, you may select cities, years, and occupations. Click here for a larger explanation of the data and the link to the visualization itself.
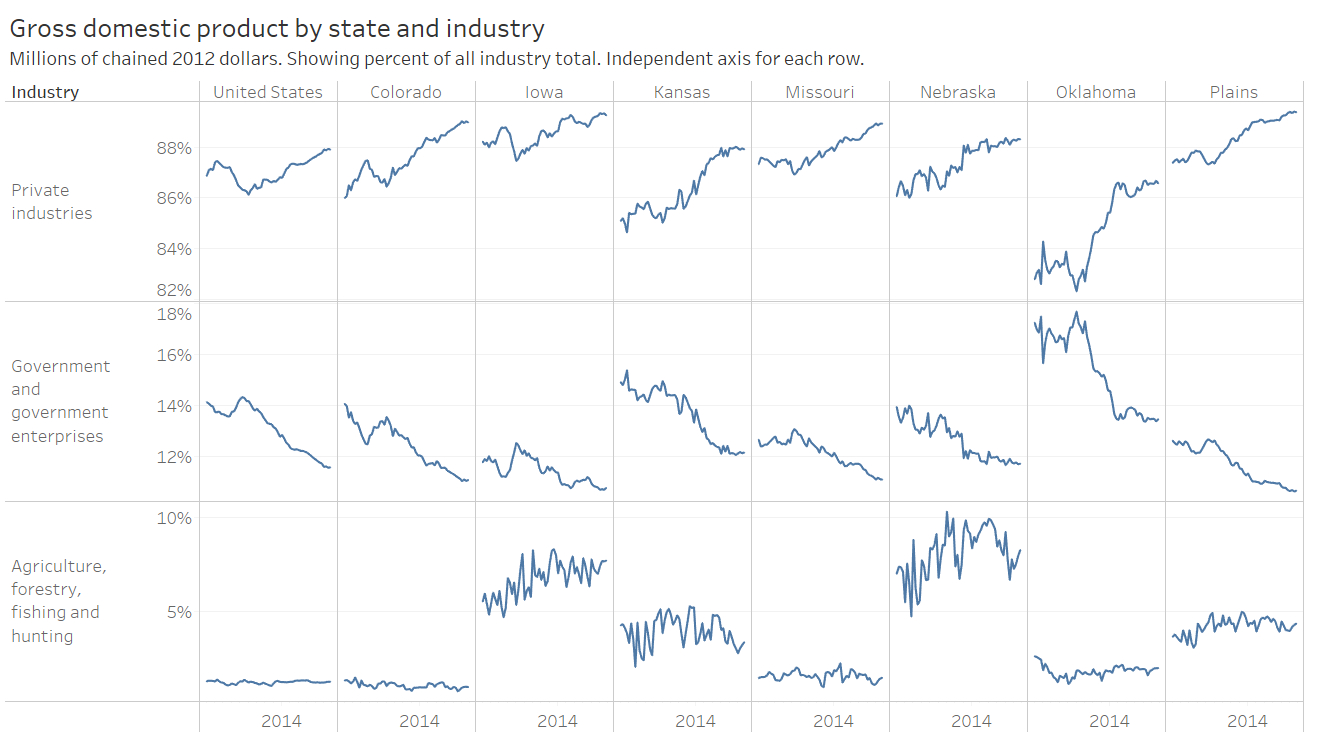
Examining changes in GDP and industry contribution in Kansas.
The interactive visualization Quarterly Real Gross Domestic Product by state and industry holds real (inflation-adjusted) GDP data for states and industries. In the visualization, one presentation shows the contribution to a state’s GDP by each industry.
The nearby example taken from the visualization shows data for Kansas and nearby states, as well as the nation. The industry “Government and government enterprises” contributes a large portion of Kansas GDP, more than any of the illustrated states except Oklahoma. This is consistent with Kansas having many government employees as compared to other states. 1
Click for larger.
We see that the industry “Agriculture, forestry, fishing and hunting’ is prominent in Kansas compared to the nation, although both Iowa and Nebraska are more reliant on this industry. Kansas is roughly equal to the Plains states in this regard. Note that agriculture is volatile.
For May 2020, total Kansas tax revenue fell by 20 percent from last May.
Tax reports from the State of Kansas for May 2020 reveal some of the effects of the response to the pandemic on state finances.
When reporting on Kansas tax collections, comparison is usually made to the estimated collections. Those estimates were revised in April based on economic conditions affected by the response to the pandemic. To get a feel for the effects of the response to the pandemic, it is best to compare to the same month the prior year.
For May 2020, individual income tax collections were $215,902,744, down 22.3 percent from last May. Retail sales tax collections declined by 13.6 percent to $173,858,126. Total tax collections were $448,655,015, down 20.3 percent. A nearby table summarizes.
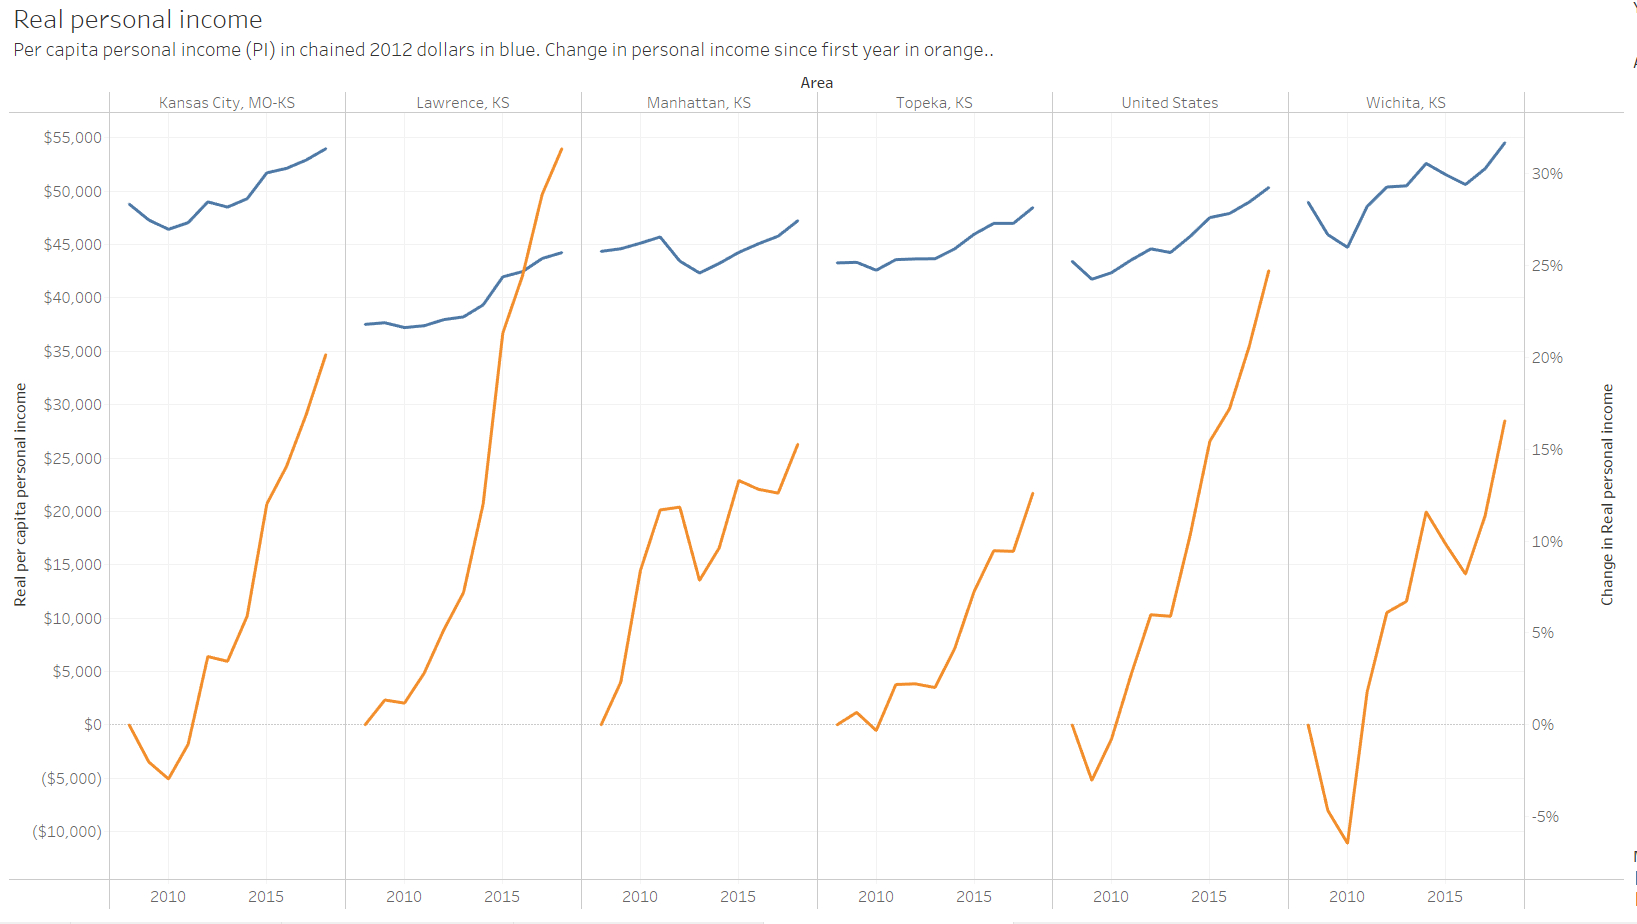
When adjusted for regional differences, personal income in Wichita and Kansas is higher than otherwise, but growth is slow.
The Bureau of Economic Analysis, a division of the United States Department of Commerce, generates personal income data for states and metropolitan statistical areas. I present this data in two interactive visualizations, one for states, and a second for metros.
When presenting economic data, the term “real” commonly means that dollar amounts have been adjusted for the effects of inflation. That is the case for this data. BEA goes further in also adjusting data for regional price parity and personal consumption expenditures price index.
The difference when using values adjusted for regional differences can be substantial. For example, when considering per capita personal income in 2018 using actual, non-adjusted dollars, Kansas ranked number 23 among the states, which is a typical value for Kansas. When adjusted for region, Kansas ranked number 16. In a nearby example from the visualization, the value of per capita personal income for Kansas is better than other states, but is growing slowly. This is easily seen when comparing Colorado to Kansas.
Click for larger.
In the example for metro areas in Kansas, Wichita’s per capita personal income is high, but growing slower than some areas, including the nation. (The Kansas City metro area includes Kansas City, Missouri and other areas in Missouri.)
Click for larger.
To learn more about this data and access the interactive visualizations, click here.
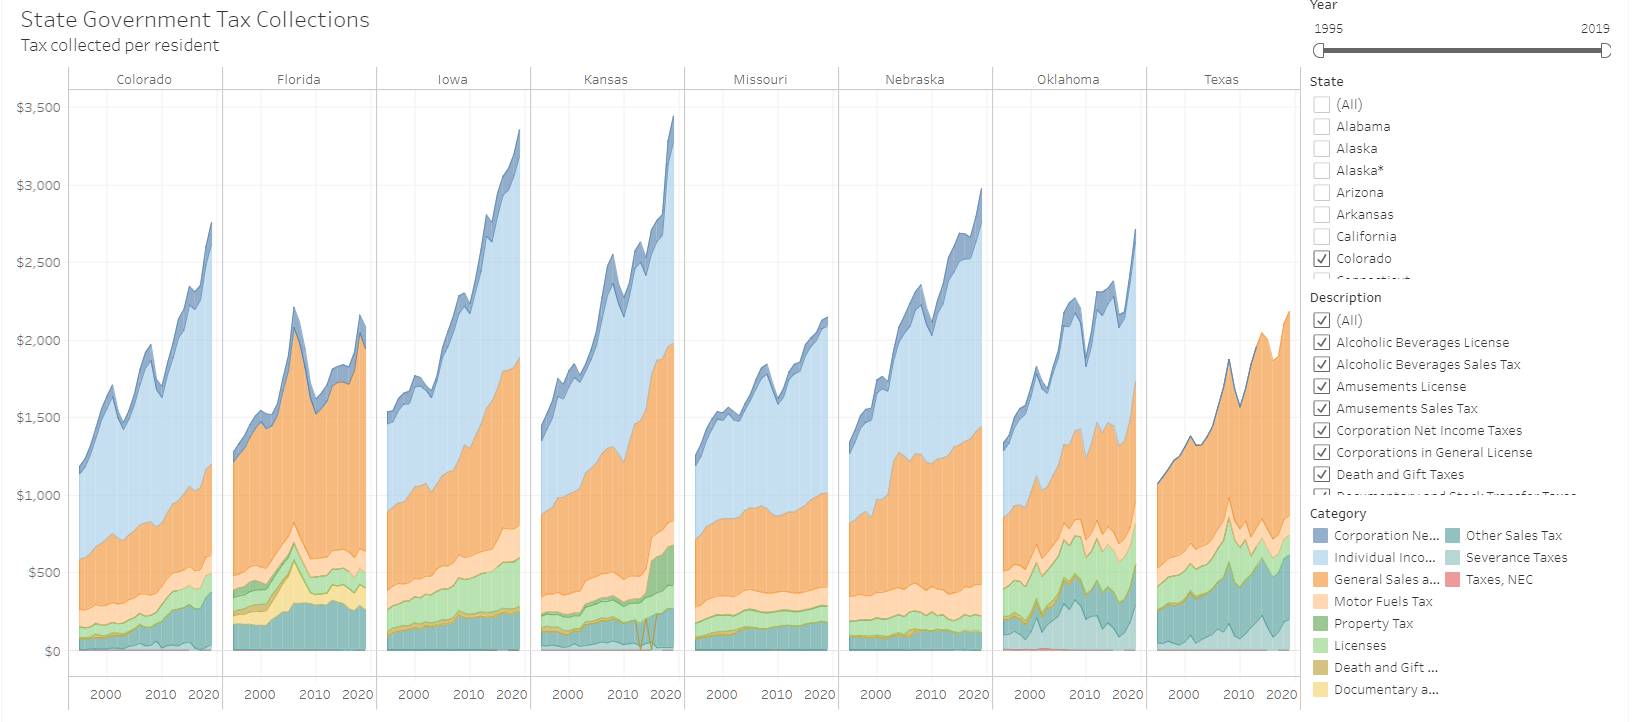
Kansas state government tax collections rose to $3,443 per person in 2019, an increase of 5.0 percent from 2018.
Each year the United States Census Bureau collects a summary of taxes collected by each state for 5 broad tax categories and up to 25 tax subcategories. 1 I’ve collected this data and made it available in an interactive visualization. Data is through 2019, released in April.
For the past two years, Kansas has collected more taxes per resident than our surrounding states. This is counting state taxes only. The primary reason for Kansas overtaking these states is the increase in individual income tax rates, which includes many businesses, even large firms. In 2019, Kansas collected $3,778.5 million in individual income taxes and $486.4 million in corporate income taxes.
Click here to learn more about the data and access the visualization.
Click images for larger versions.
In the following chart showing total tax collections per person over time, Kansas now collects more than our surrounding states.
This chart shows individual income tax collections only, with Kansas highlighted. The wide swings over the past decade are evident.
For April, Kansas retail sales tax collections fell by 8.2 percent from last April, and much income tax revenue is deferred to July.
Two reports from the State of Kansas reveal some of the effects of the response to the pandemic on state finances.
On the current situation, the Consensus Revenue Estimating Group remarked, “given the magnitude and number of uncertainties that currently exist, and the potential for volatility of our forecasts has never been higher.” The group met on April 20, 2020, and issued its long-form report dated April 30.
For revenue, the group “decreased the overall estimate for FY 2020 and FY 2021 by a combined $1.272 billion relative to the previous estimate made in November.” Fiscal year 2020 ends on June 30, 2020.
When reporting on Kansas tax collections, the comparison is usually made to the estimated collections. Those estimates have been revised in April. To get a feel for the effects of the response to the pandemic, it is best to compare to the same month the prior year, with a few caveats.
For example, individual income tax revenue fell by $526 million (65.0 percent) from last April, based on a revenue report released on May 1. Corporate income tax revenue fell by nearly the same percentage. The estimating group notes that the deadline for filing and paying these taxes was moved from April to July, which explains the steep decline. The CRE group estimates $645.8 million of tax revenue will be deferred to July, which is in fiscal year 2021. Note that this revenue is deferred, meaning the state still expects to collect it, as it reflects economic activity during calendar year 2019, before the response to the pandemic.
Retail sales tax collections fell by $16 million (8.2 percent) from last April. For all excise taxes, which includes retail sales tax, revenue fell by $11 million (4.5 percent). Compensating use tax rose by $5 million (14.9 percent).
My interactive visualization of Kansas tax revenue has been updated with April data. Click here to use it.
I’ve gathered data from BLS and present it in an interactive visualization with tables, charts, and a map. Click here to learn more and use the visualization. Below is an example from the visualization.