Tag: Visualizations

Following are visualizations of data. Many are interactive and created using Tableau Public. In some cases I’ve recorded myself using the visualization to tell a story, and all you have to do is watch.

  • Kansas tax receipts

    Kansas tax receipts

    News about Kansas tax receipts for November 2017, along with an interactive visualization.

    Following is a press release from the Kansas Department of Revenue regarding November 2017 tax receipts. For an interactive visualization of this data, see Visualization: Kansas tax receipts.


    December 1, 2017
    Tax receipts show promise of improved economy

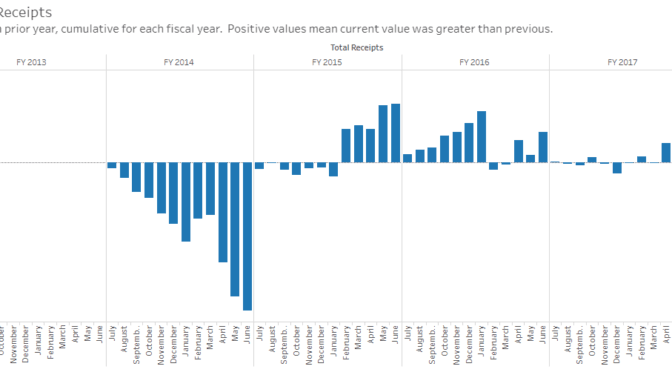
    TOPEKA–The state has collected $258.75 million over last fiscal year at this time, totaling over 11 percent growth in collections according to data from the latest revenue report released Friday.

    So far this fiscal year that started in July, the state has collected $1.09 billion in total individual income tax, which amounts to $176.74 million over last year. In the same time, sales tax collections total $985.71 million, putting it $41.64 million over last year or over 4 percent growth. Corporate income tax continues the multi month trend of outperforming the previous year, hitting a value of $30.51 million over last year’s cumulative collections.

    “Sales tax receipts have reached what appears to be stable growth above last year’s collections,” Revenue Secretary Sam Williams said. “Individual income tax collections are also above last year by a wide margin, but it’s difficult to distinguish the impact of the recent tax increase versus economic growth, and we won’t be able to discern that until April.

    November tax receipts totaled $463.50 million, which is $62.23 million over November last year. Individual income tax collections totaled $207.62 million for the month, while sales tax revenue came in at $192.63 million. Corporate income tax totaled $379,518.

    Example from the visualization. Click for larger.
  • Wichita personal income up, a little

    Wichita personal income up, a little

    For 2016, personal income in Wichita rose, but is still below 2014 levels.

    The Bureau of Economic Analysis, an agency of the United States Department of Commerce, has released personal income figures for metropolitan areas through 2016. For the Wichita metropolitan statistical area, personal income in 2016 rose slightly from 2015 level, but is still below the 2014 level. In real (inflation-adjusted) dollars, personal income fell in 2016.

    Click for larger.

    The trend in personal income mirrors that of the Wichita-area GDP, which is the value of goods and services produced. That fell in 2016. 1

    To access an interactive visualization of personal income for all metropolitan areas, click here.

    Example from the visualization. Click for larger.


    Notes

    1. Weeks, Bob. Wichita economy shrinks. Available at https://wichitaliberty.org/economics/wichita-economy-shrinks/.
  • Kansas school fund balances

    Kansas school fund balances

    Kansas school fund balances rose this year, in both absolute dollars and dollars per pupil.

    As Kansans debate school funding, as the Kansas Supreme Court orders more school spending, and as schools insist that spending has been slashed, a fact remains: Kansas schools don’t spend all the money they’ve been given. Unspent fund balances grow in many years, and grew this year.

    Fund balances are necessary for cash flow management. They buffer the flows of receipts and expenditures. The issue is what levels of balances are necessary, and, more importantly, how the balances change over years.

    In Kansas, school districts report fund balances on July 1 of each year. Looking at fund balances on that date over time gives insight into how districts are managing receipts and expenditures. If a fund balance falls from July 1 of one year to July 1 of the next year, it means that the district spent more money from the fund than it put in the fund. The opposite is also true: If a balance rises, it means less was spent than was put in.

    Based on recent data from the Kansas State Department of Education, fund balances rose rapidly after 2008, remained largely level from 2011 through 2015, and rose for 2016 and 2017.

    For the school year ending in 2017, total fund balances were $2,016,863,070. (This value does not include non-school funds like museums and recreation center funds.) For 2016, the figure was $1,871,026,493. This is an increase of $145,836,577, or 7.8 percent.

    Around half of these fund balances are in bond and capital funds, which are different from operating funds. Without these capital funds, balances rose from $935,116,567 to $970,188,922. This is an increase of $35,072,355, or 3.8 percent.

    When fund balances rise, it is because schools did not spend all their revenue. If schools say that cuts had to be made, and at the same time fund balances are rising, Kansans might wonder why schools did not spend some of these idle fund balances.

    I’ve gathered data about unspent Kansas school funds from Kansas State Department of Education and present it as an interactive visualization in a variety of tables and charts. Data is available for each district since 2008. You may explore the data yourself by using the visualization. Click here to open it in a new window. Data is from Kansas State Department of Education in current dollars (not adjusted for inflation). Visualization created using Tableau Public.

    Top chart: Fund balances in all funds except non-school funds. Bottom: Without bond and capital funds. Click for larger.
  • Kansas hotel tax collections

    Kansas hotel tax collections

    Kansas hotel guest tax collections presented in an interactive visualization.

    Cities and counties in Kansas may levy a transient guest tax collection on hotel guests. It is sometimes called a bed tax or guest tax. The tax is collected as a percentage of total room revenue, not the number of rooms or the rate charged for rooms. While the Kansas Department of Revenue collects the tax, the proceeds are returned to the cities or counties, except for a two percent processing fee. In Wichita the rate is six percent.

    In some cases, jurisdictions may levy additional taxes that may not be paid to the Kansas Department of Revenue. This is the case with the Wichita city tourism fee, which took effect on January 1, 2015. This tax of 2.75% is paid directly to the city1, so it doesn’t appear in KDOR figures.

    Also, jurisdictions may change the tax rate. The Kansas Department of Revenue maintains a list of taxes charged. 2

    The visualization has three views of data. One is a table of collections, including percent change from the previous year. A line chart shows the dollar amount of collections. A second line chart shows collections indexed to a common starting point. This is useful for comparing the relative change in guest tax collections. These line charts show data as the average of the previous 12 months.

    Examples of nondisclosure.
    This data does not represent all hotels in Kansas. Confidentiality rules prohibit disclosure when a jurisdiction has a small number of hotels. In the nearby example, the value “C” is reported for Sedgwick County, indicating such non-disclosure. Obviously, there are hotels in Sedgwick County. But considering hotels in Sedgwick County that are not located in cities like Wichita, the number is too small to report, based on confidentiality guidelines. Similarly, for small cities, data is probably not available to the public.

    Of note, while Wichita is the largest city in Kansas, Overland Park collects the most hotel guest tax. Of the largest markets in Kansas, Wichita has experienced the least growth in hotel tax collections since 2010.

    Click here to access the visualization.

    Guest tax collections in largest hotel markets in Kansas, indexed change. Click for larger.


    Notes

    1. City of Wichita ordinance 49-745. Available at http://www.wichita.gov/CityClerk/OrdanicesDocuments/49-745%20TBID%20Fee%20Ordinance.pdf.
    2. Kansas Department of Revenue. Transient Guest Tax Rates, Effective Dates, and Number of Active Accounts. Available at https://www.ksrevenue.org/pdf/tgratesfilers.pdf.
  • Wichita employment trends

    Wichita employment trends

    While the unemployment rate in the Wichita metropolitan area has been declining, the numbers behind the decline are not encouraging.

    The unemployment rate, a widely-cited measure of the health of an economy, is not an absolute measure. Instead, it is a ratio, specifically the ratio of the number of unemployed people to the number of people in the labor force. (The labor force, broadly, is the number of persons working plus those actively looking for work. 1)

    It is entirely possible that the unemployment rate falls while the number of people employed also falls. This is the general trend in Wichita for the past seven years or so. Here are some figures from Bureau of Labor Statistics, part of the United States Department of Labor: 2

    The May 2017 unemployment rate declined to just about half the January 2011 rate. The number of employed persons rose by 1.1 percent. The labor force fell by 3.7 percent.

    If we consider only unemployment rate, it looks like the Wichita area is prospering. But the unemployment rate hides bad news: The number of jobs increased only slightly, and the labor force fell. While it’s good that there are more people working, the decline in the labor force is a problem.

    In the nearby chart you can see these effects. The unemployment rate has been declining, although it has recently increased slightly. The labor force has been declining. The number of employed persons has increased, although it has recently declined.

    To use an interactive visualization of employment data for Wichita, click here.

    Example from the visualization. Click for larger.


    Notes

    1. The labor force, specifically the civilian labor force, are those people working, plus those people actively searching for work, minus people under 16 years of age, minus people living in institutions (for example, correctional facilities, long-term care hospitals, and nursing homes), minus people on active duty in the Armed Forces.
      BLS defines unemployed people as: “Persons aged 16 years and older who had no employment during the reference week, were available for work, except for temporary illness, and had made specific efforts to find employment sometime during the 4-week period ending with the reference week. Persons who were waiting to be recalled to a job from which they had been laid off need not have been looking for work to be classified as unemployed.”
      The unemployment rate is “the number unemployed as a percent of the labor force.”
      Bureau of Labor Statistics. Glossary. Available at https://www.bls.gov/bls/glossary.htm.
    2. Bureau of Labor Statistics. Labor Force Statistics from the Current Population Survey. Available at https://www.bls.gov/cps/.
  • Tax collections by the states

    An interactive visualization of tax collections by state governments.

    Each year the United States Census Bureau collects data from the states regarding tax collections in various categories. I present this data in an interactive visualization.

    The values are for tax collections by the state only, not local governmental entities like cities, counties, townships, improvement districts, cemetery districts, library districts, drainage districts, watershed districts, and school districts.

    Of particular interest is the “Total by State” tab. Here you can select a number of states and compare their tax burdens. (Probably three or four states at a time is the practical limit.) This data is presented on a per-person basis.

    From this data we can see a number of valuable comparisons. For example, it is often said in Kansas that we can’t eliminate our income tax as has Texas, because we don’t have as much oil severance tax revenue. From the data we see that Texas collected $84 per person in severance tax, while Kansas collected $17 per person. This difference is much smaller than the difference in total tax collections between these states.

    Similarly, when comparing Kansas to Florida — which like Texas has no income tax — the large amount of tourism in Florida is said to generate enough revenue to allow zero income tax. But, in 2016 Florida collected $1,081 per person in sales tax, while Kansas collected $1,115 per person. Florida does not collect sales tax on groceries, so it may be that visitors pay more of the sales tax burden. But, Kansas still collects more sales tax on a per-capita basis, and Kansas collects much more tax in total than Florida, again on a per-capita basis.

    Data is as collected from the United States Census Bureau, Annual Survey of State Government Tax Collections, and not adjusted for inflation. Visualization created using Tableau Public. Click here to access the visualization.

    Example from the visualization. Click for larger.
  • National Transit Database, an interactive visualization

    National Transit Database, an interactive visualization

    An interactive visualization of data over time from the National Transit Database.

    Do you wonder how much it costs to run your transit system? The National Transit Database holds data for transit systems in the U.S. I’ve gathered some key statistics and presented them in an interactive visualization.

    In the case of Wichita, we see that “OpExp per PMT” for 2015 is $1.02. This is total operating expense per passenger mile traveled. It’s not the cost to move a bus a mile down the street. It’s the cost to move one passenger one mile. And, it is operating cost only, which means the costs of the buses are not included.

    Some definitions used in the database:

    • UZA: The name of the urbanized area served primarily by a transit agency.
    • UPT: Unlinked passenger trips.
    • PMT: Passenger miles traveled.
    • Total OpExp: Total operating expense.

    The visualization holds three tabs. One is a table of figures. The other two illustrate data for a single transit system or single mode.

    Click here to access the visualization.

    Example from the visualization for Wichita. Click for larger.
  • Airport traffic statistics, 2016

    Airport traffic statistics, 2016

    Airport traffic data presented in an interactive visualization, updated through 2016.

    Example from the visualization, showing Wichita compared to all airports. Click for larger.
    A few observations regarding Wichita airport traffic as compared to the nation:

    • Since 2014, passenger traffic at the Wichita airport has been level, while increasing for the nation.
    • The number of departures has been declining in Wichita, while level and increasing for the nation.
    • The number of available seats on departing flights from Wichita has been mostly level while rising for the nation.

    To view and use the interactive visualization, click here.

  • Kansas Special Congressional Election

    Kansas Special Congressional Election

    An interactive map of voting in the special congressional election in Kansas district 4, for Sedgwick County only.

    Intensity of red indicates higher percentage of votes for Ron Estes. By using the interactive map (link below) you may zoom and pan. Click on a precinct to see details of its vote. Precinct sizes — in terms of the number of voters — vary widely. Precincts cast anywhere from one to 950 votes.

    This is data for Sedgwick County only. (It’s the only data I have at the moment.) Sedgwick County cast 67.9 percent of the votes in the district.

    Click here to access the interactive map. Built with Google Fusion tables.