Tag: Visualizations
-
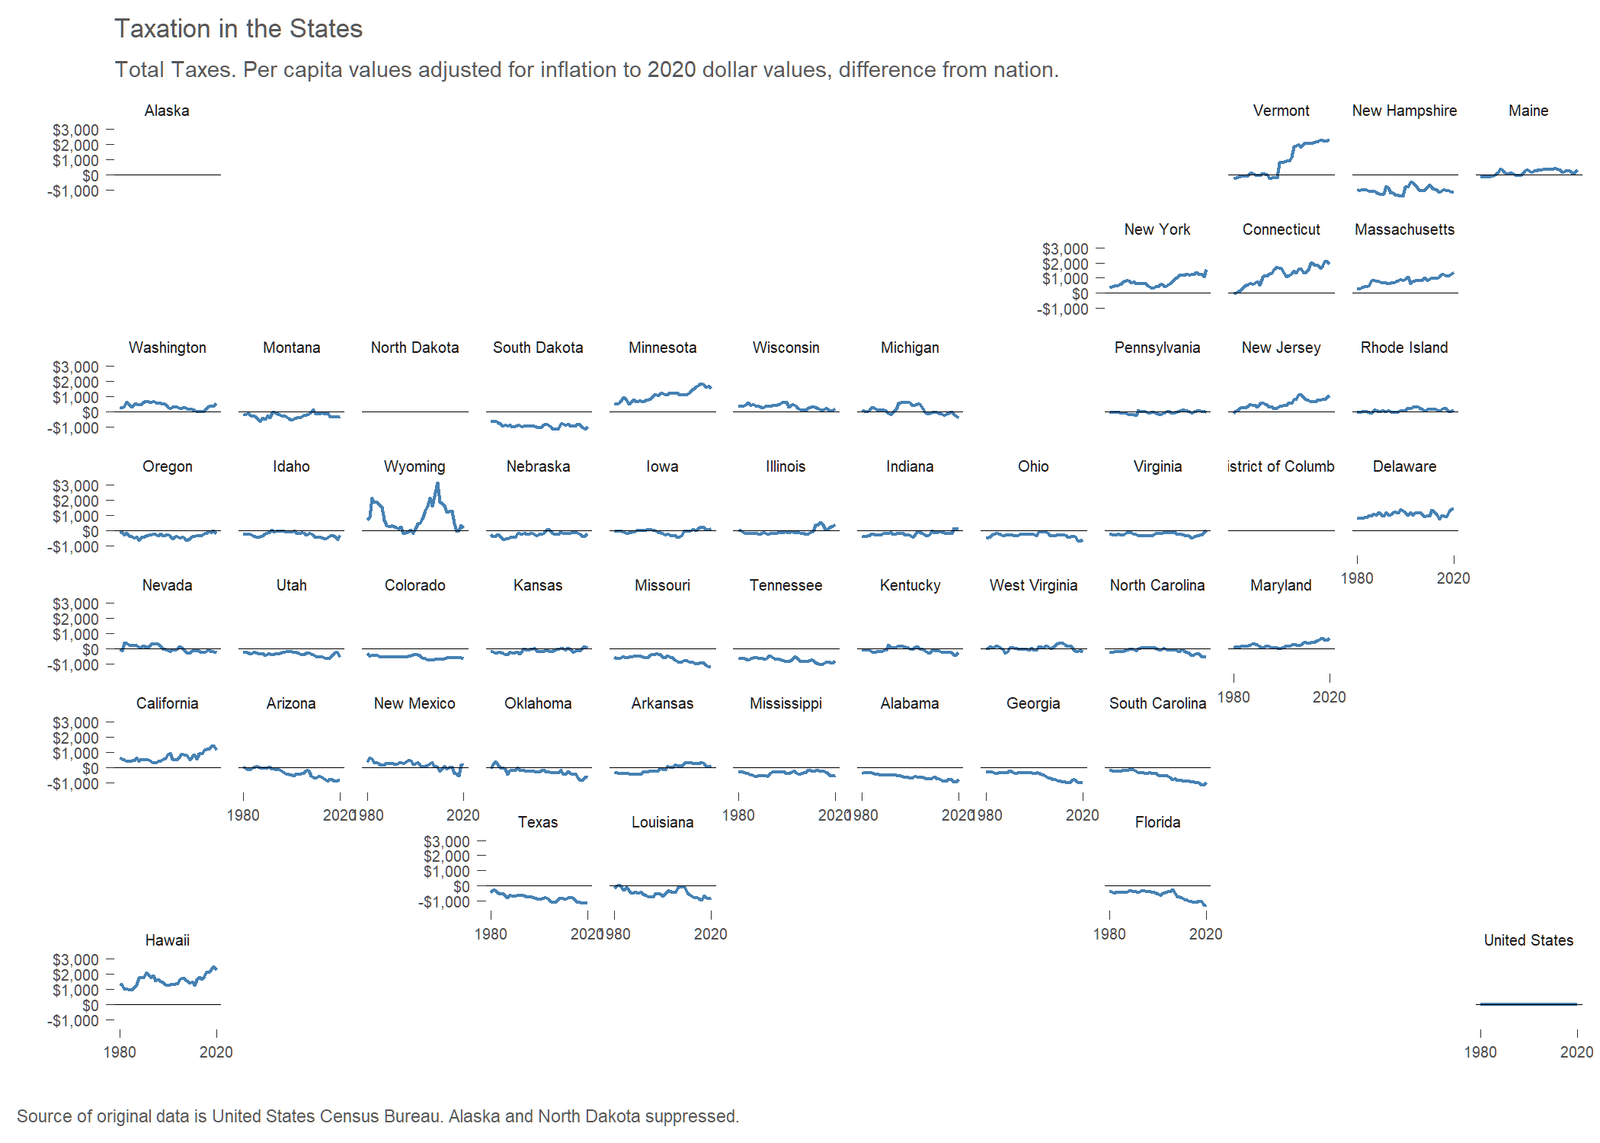
Taxation in the States
How does taxation differ in the states? There can be large differences.
-
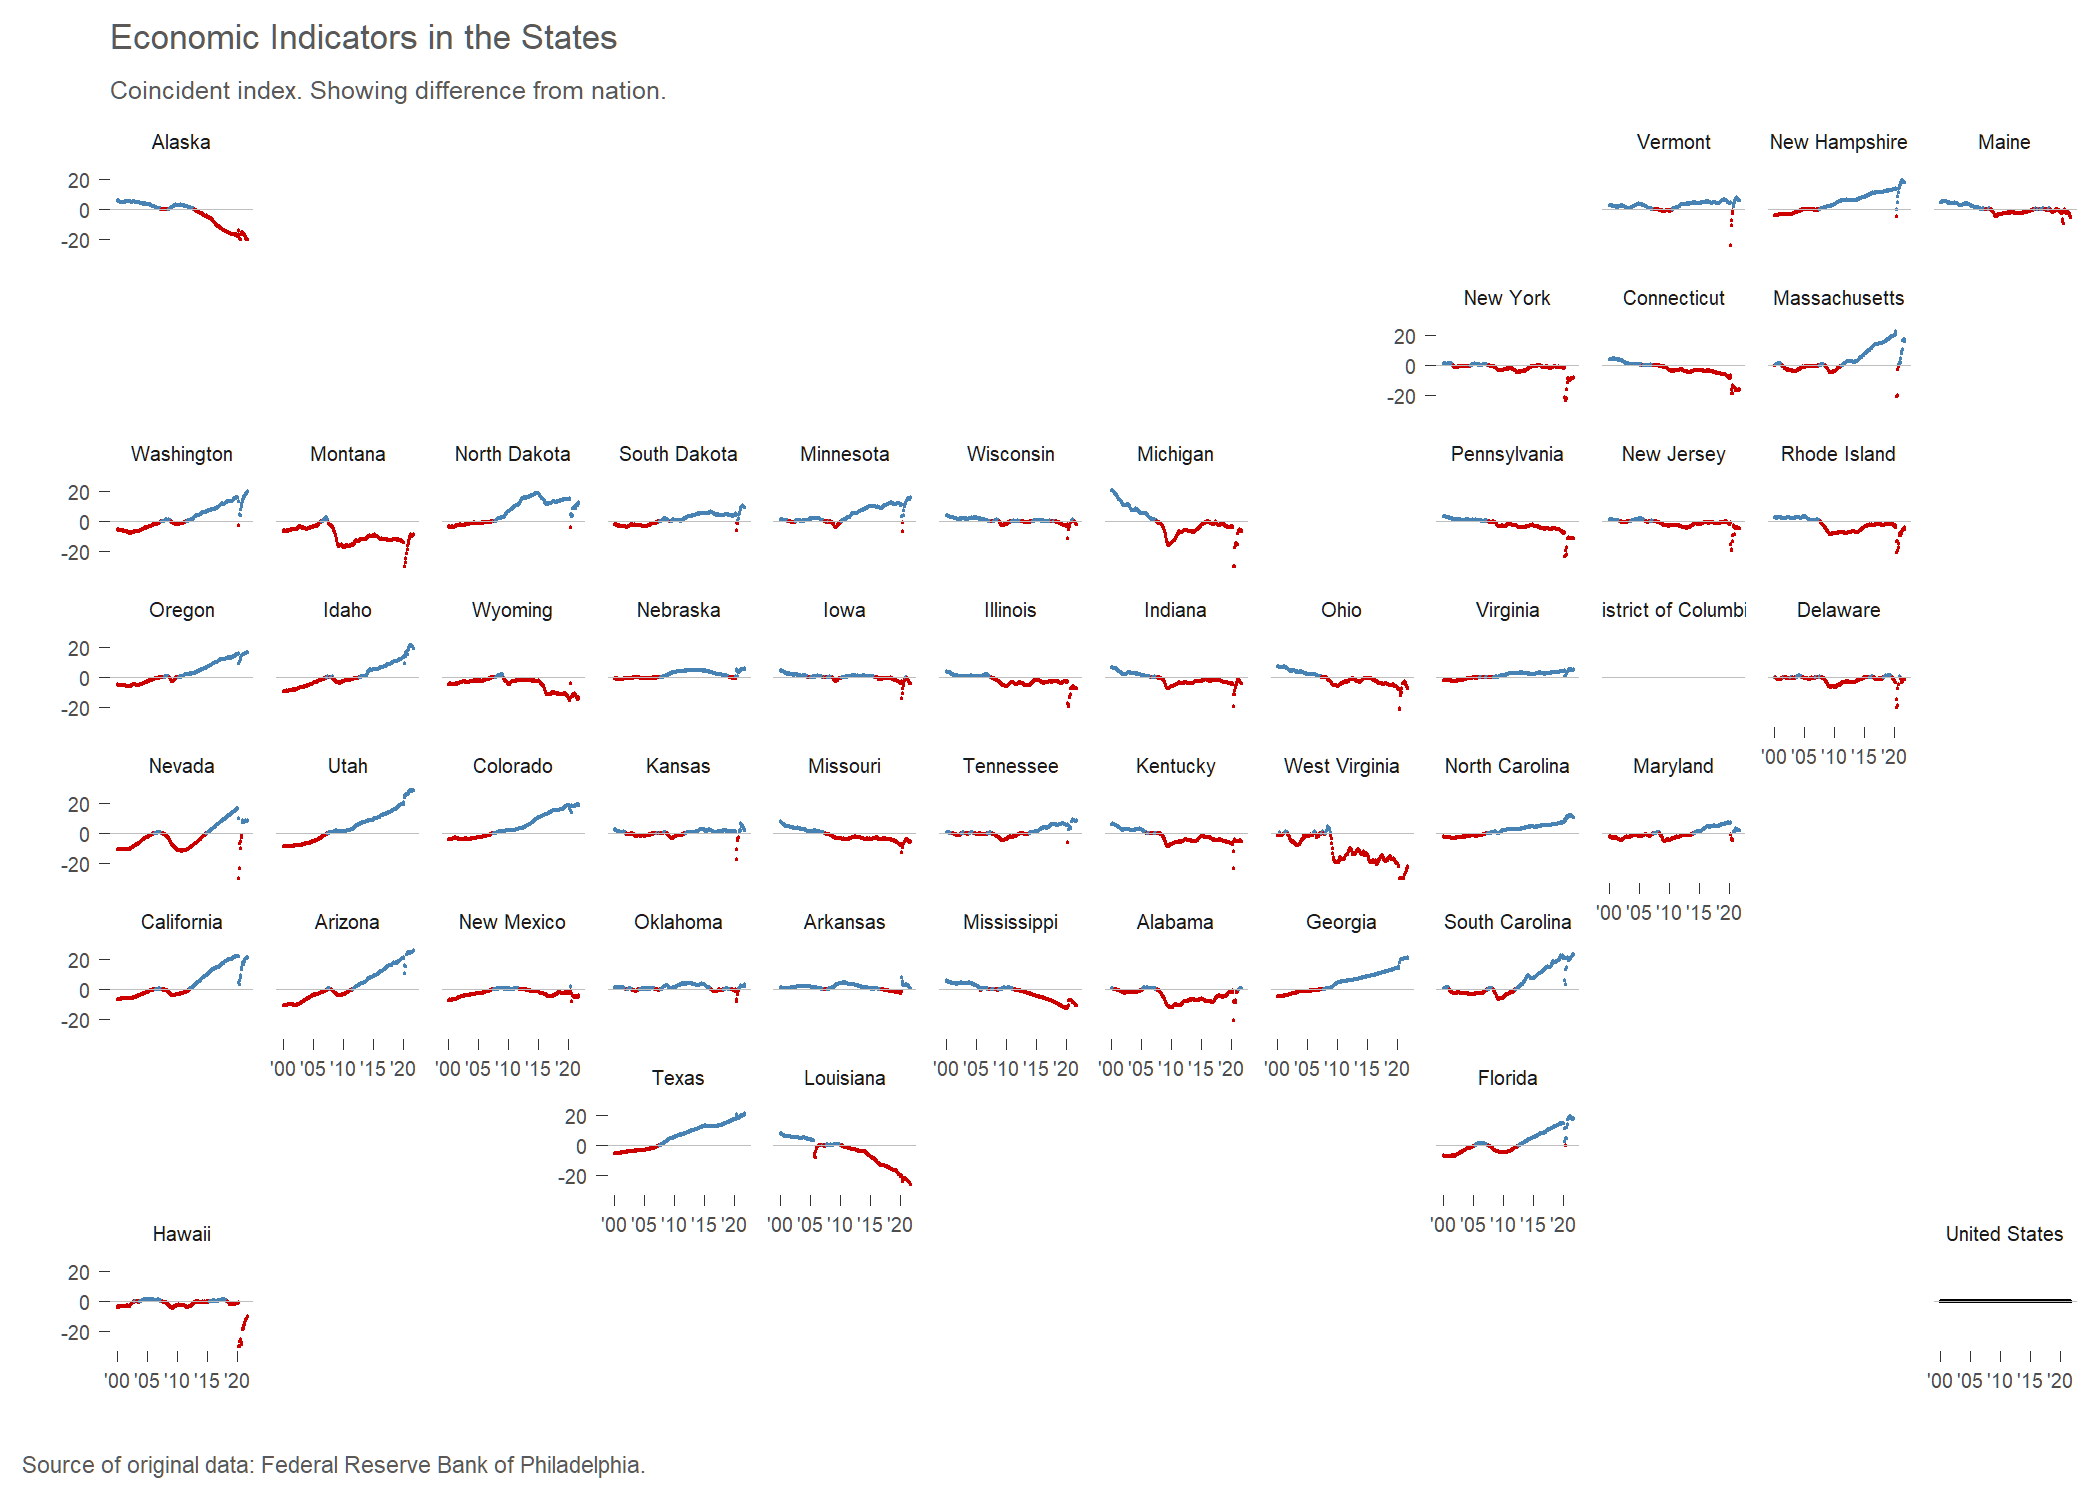
Updated: Economic Indicators in the States
A visualization of coincident and leading economic indicators for the states.
-
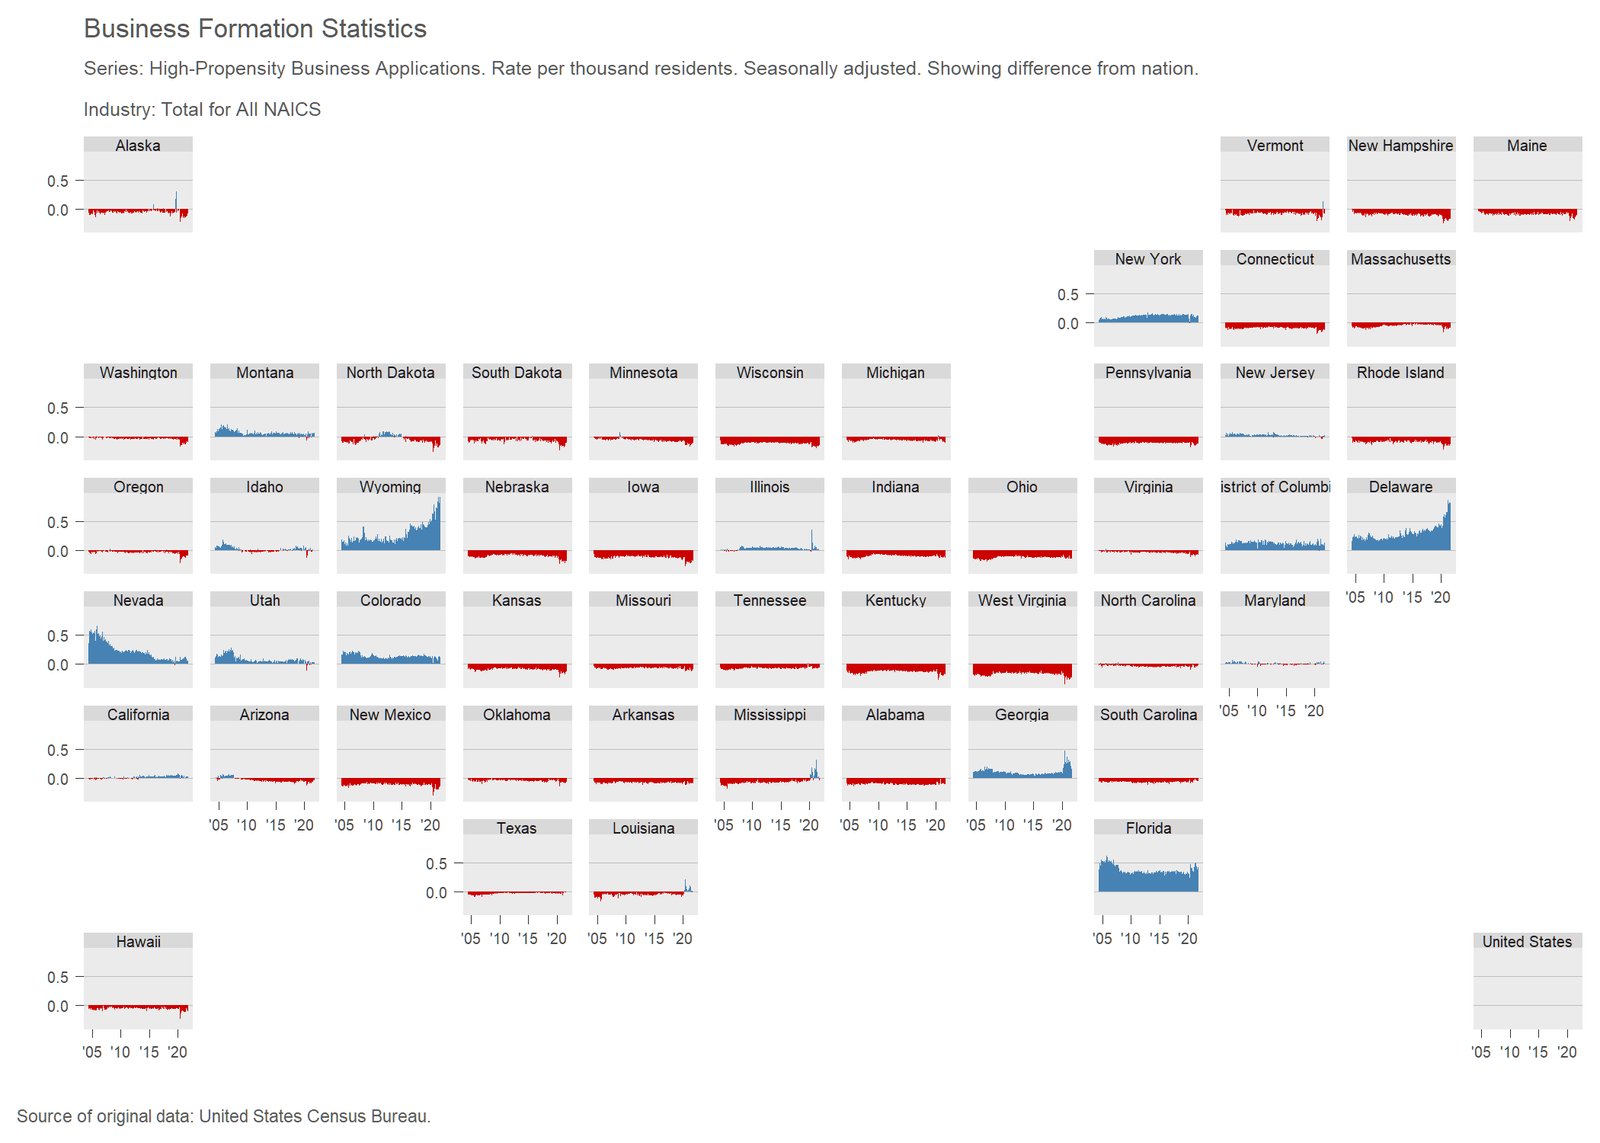
Business Formation in Kansas
For both business applications and business formations, Kansas is growing slowly compared to other states.
-
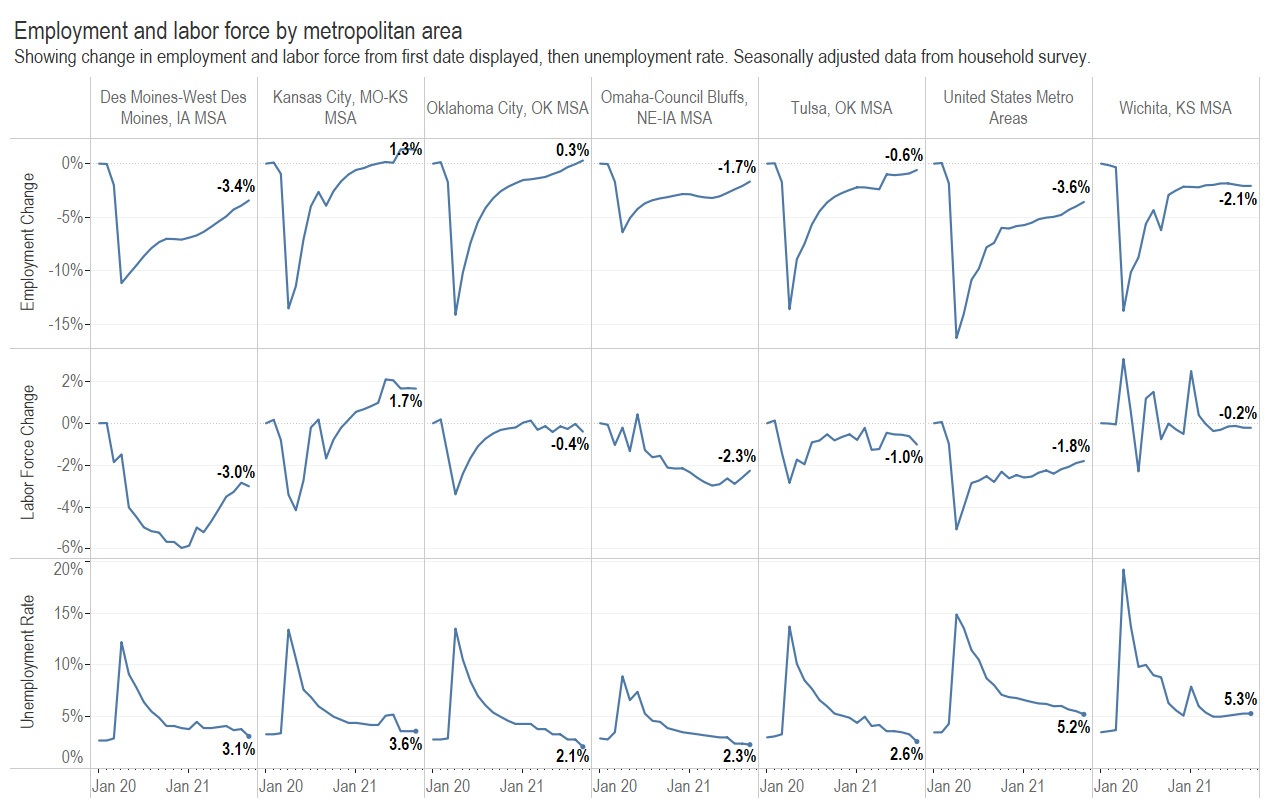
Wichita since the start of the pandemic
How has Wichita fared since the start of the pandemic compared to other metropolitan areas?
-
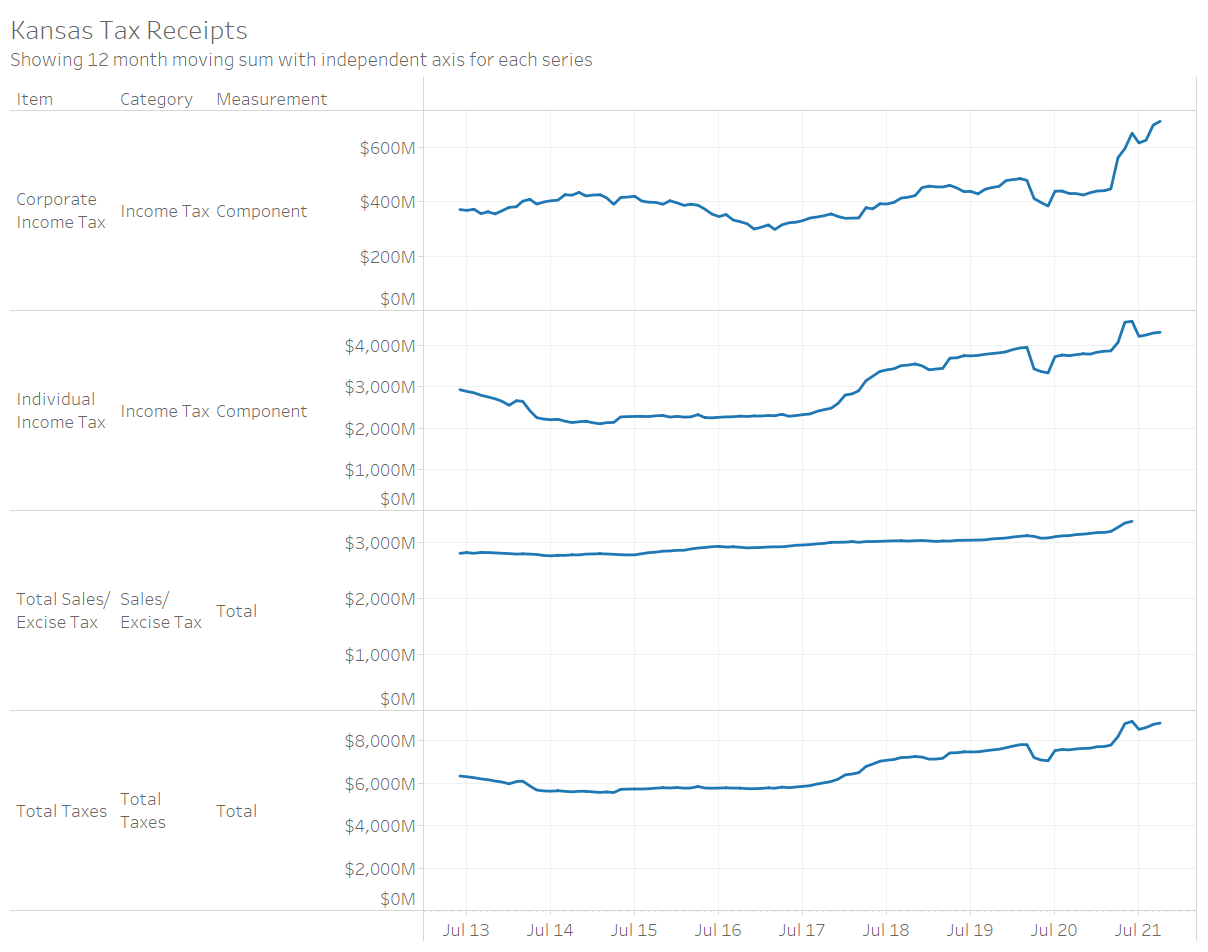
Kansas tax revenue, October 2021
For October 2021, Kansas tax revenue was 11.1 percent greater than October 2020, and 24.4 percent less than September.
-
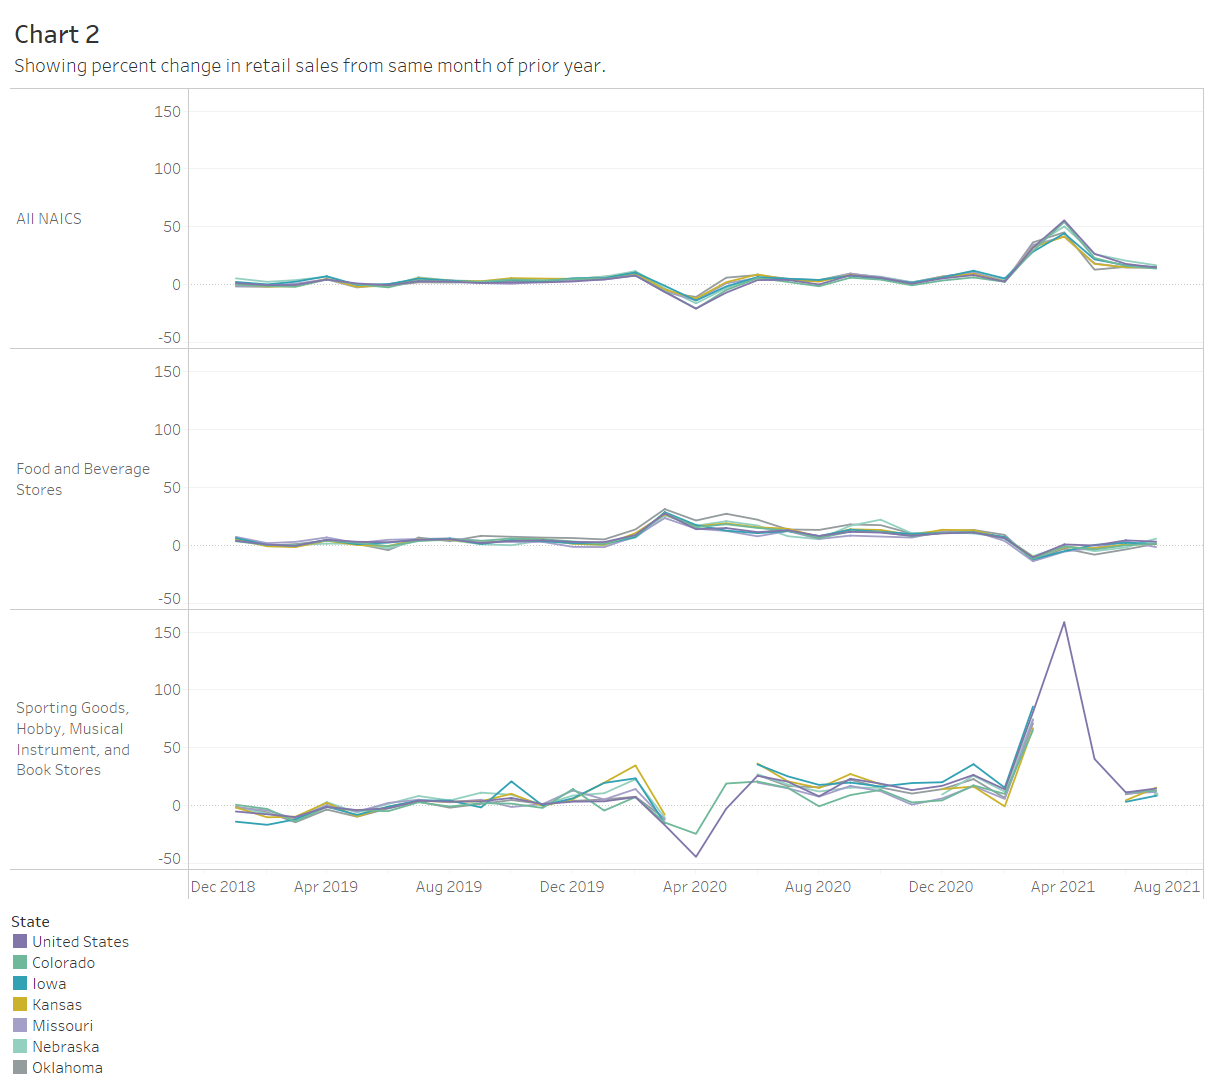
Monthly state retail sales
Monthly retail sales by state and major retail sector, in an interactive visualization.
-
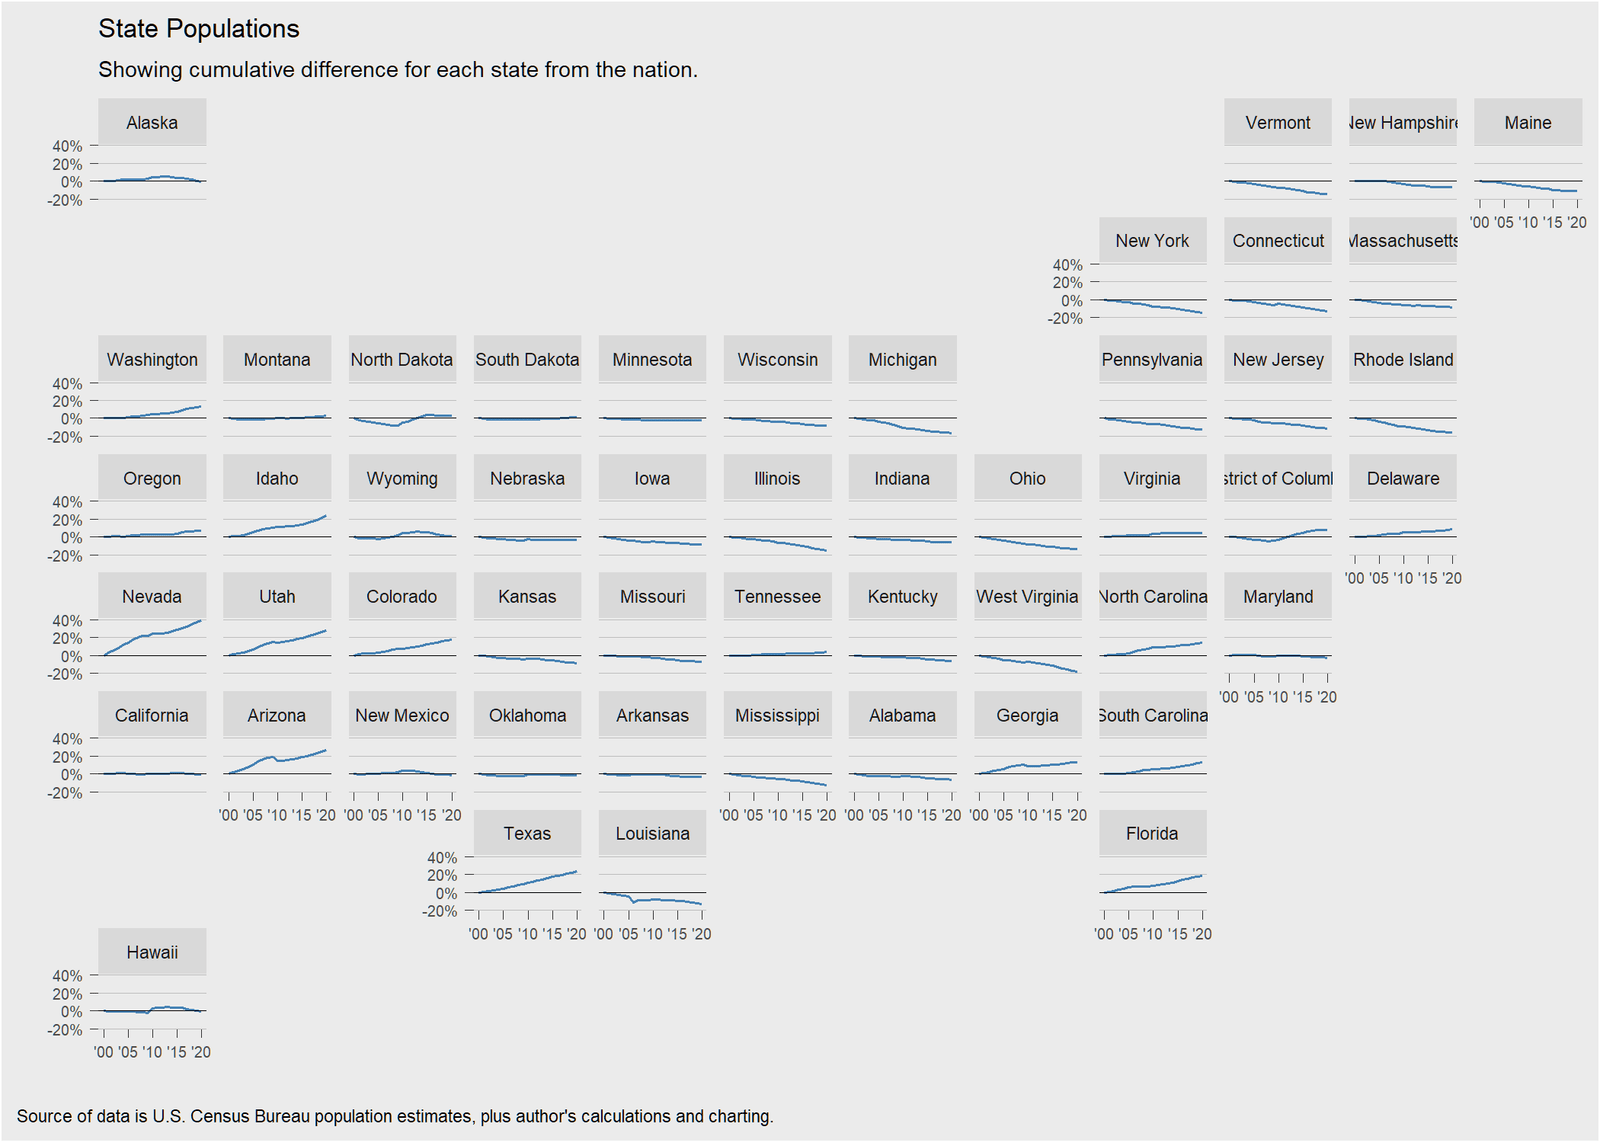
Population of the States
Population growth (or loss) is not distributed uniformly among the states.
-
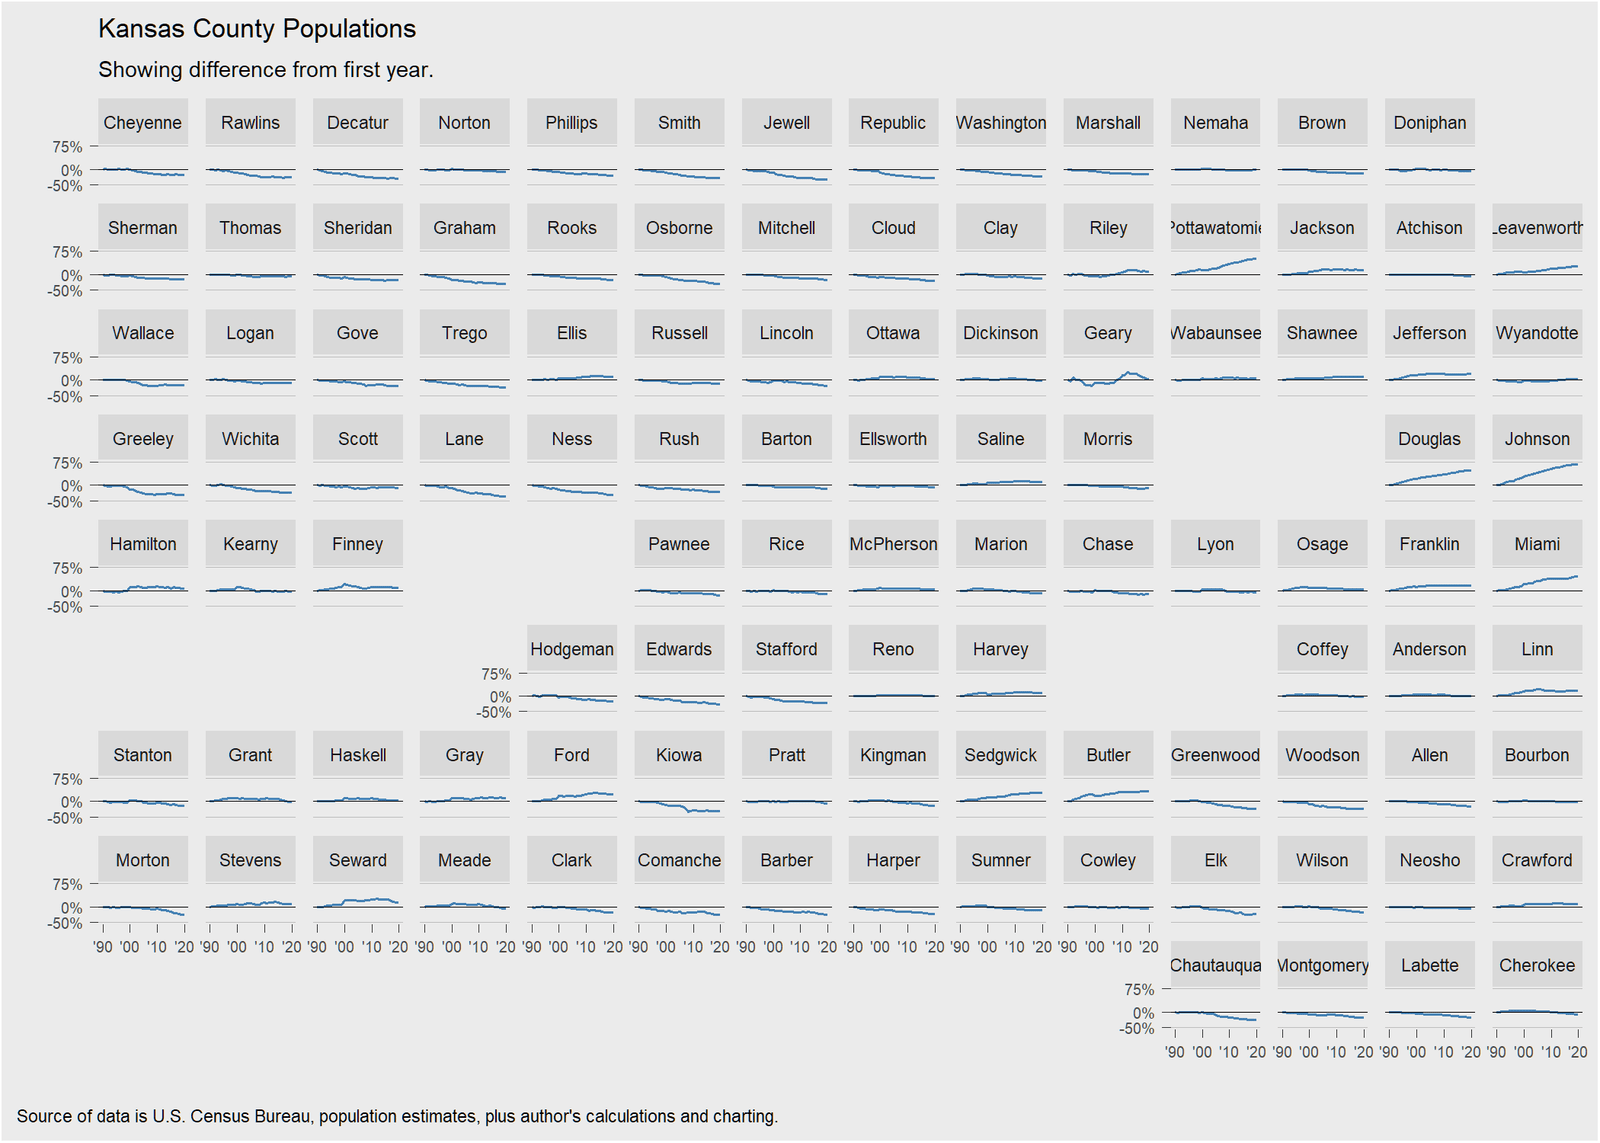
Kansas County Population
There are large differences in the trend of population among Kansas counties.
-
Kansas tax revenue, September 2021
For September 2021, Kansas tax revenue was 20.2 percent greater than September 2020, and 4.4 percent greater than August.
-
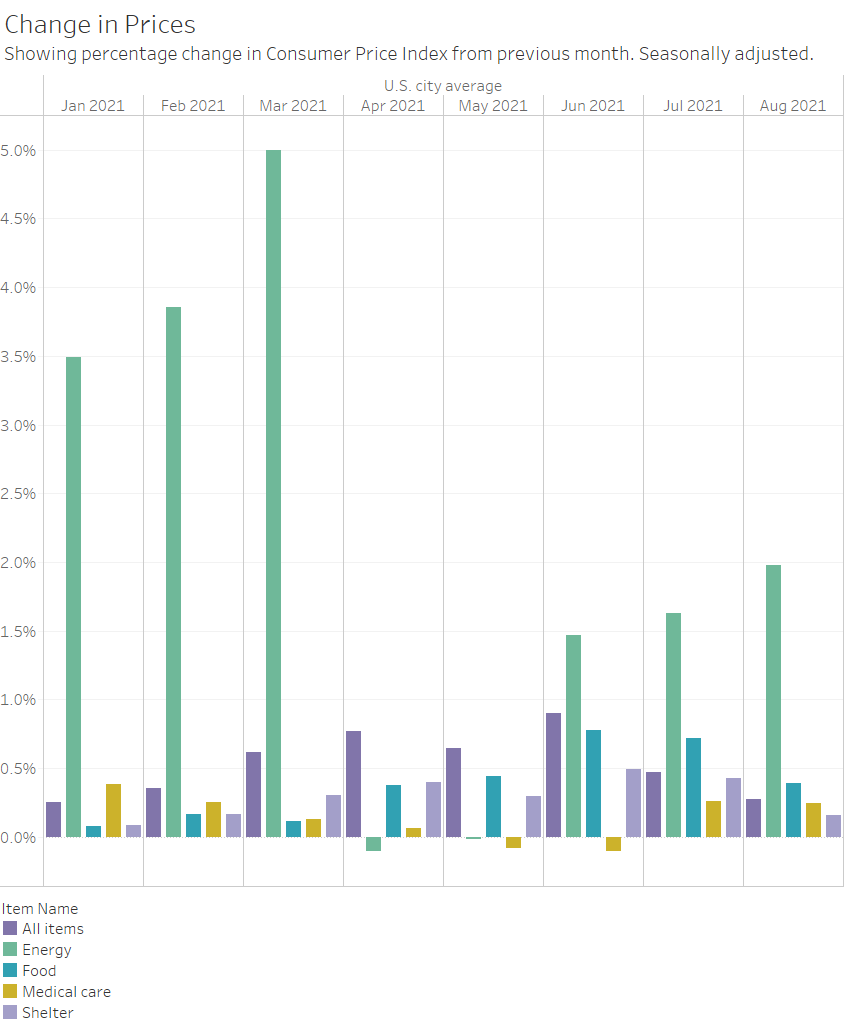
Inflation slows in August
In August 2021, inflation remains high, although the rate fell from July.
-
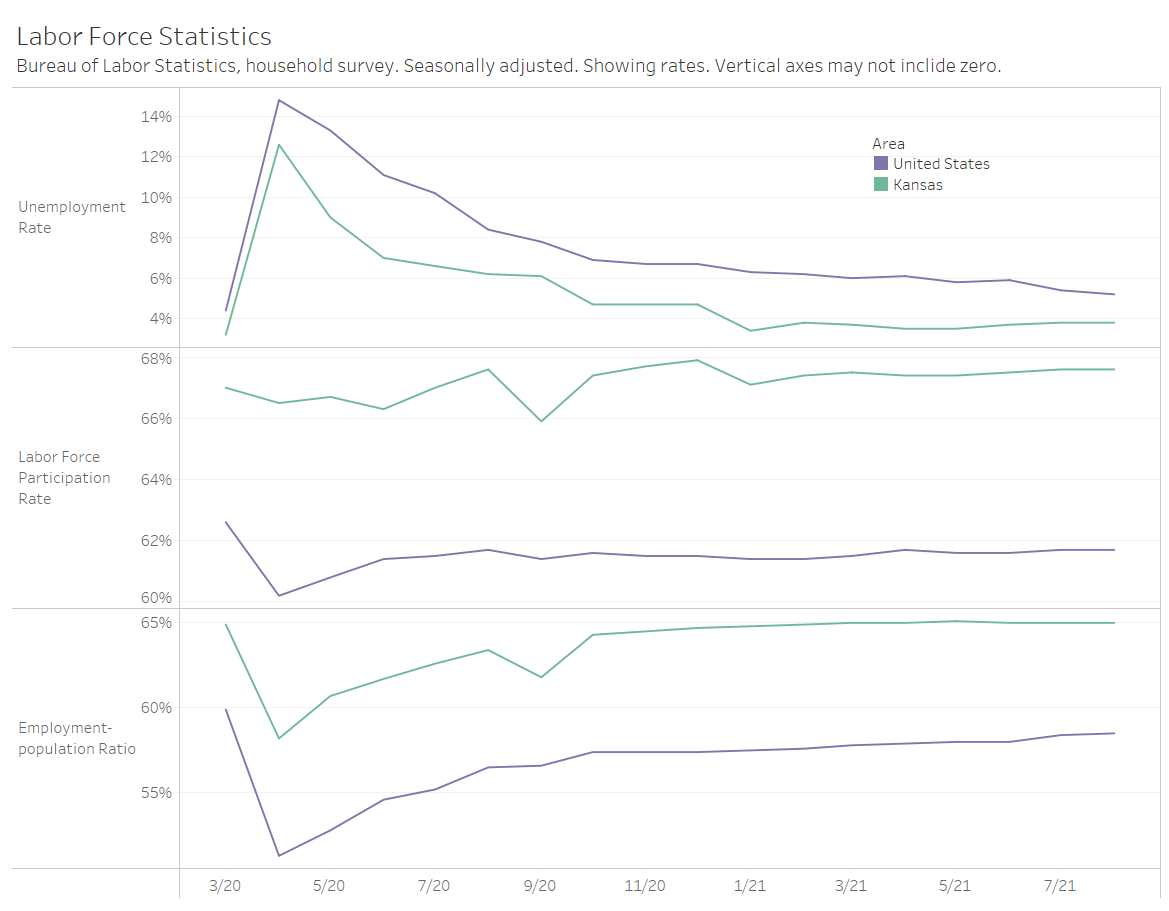
Kansas since the start of the pandemic
How has Kansas fared since the start of the pandemic compared to other states and the nation? Updated through August 2021.
-
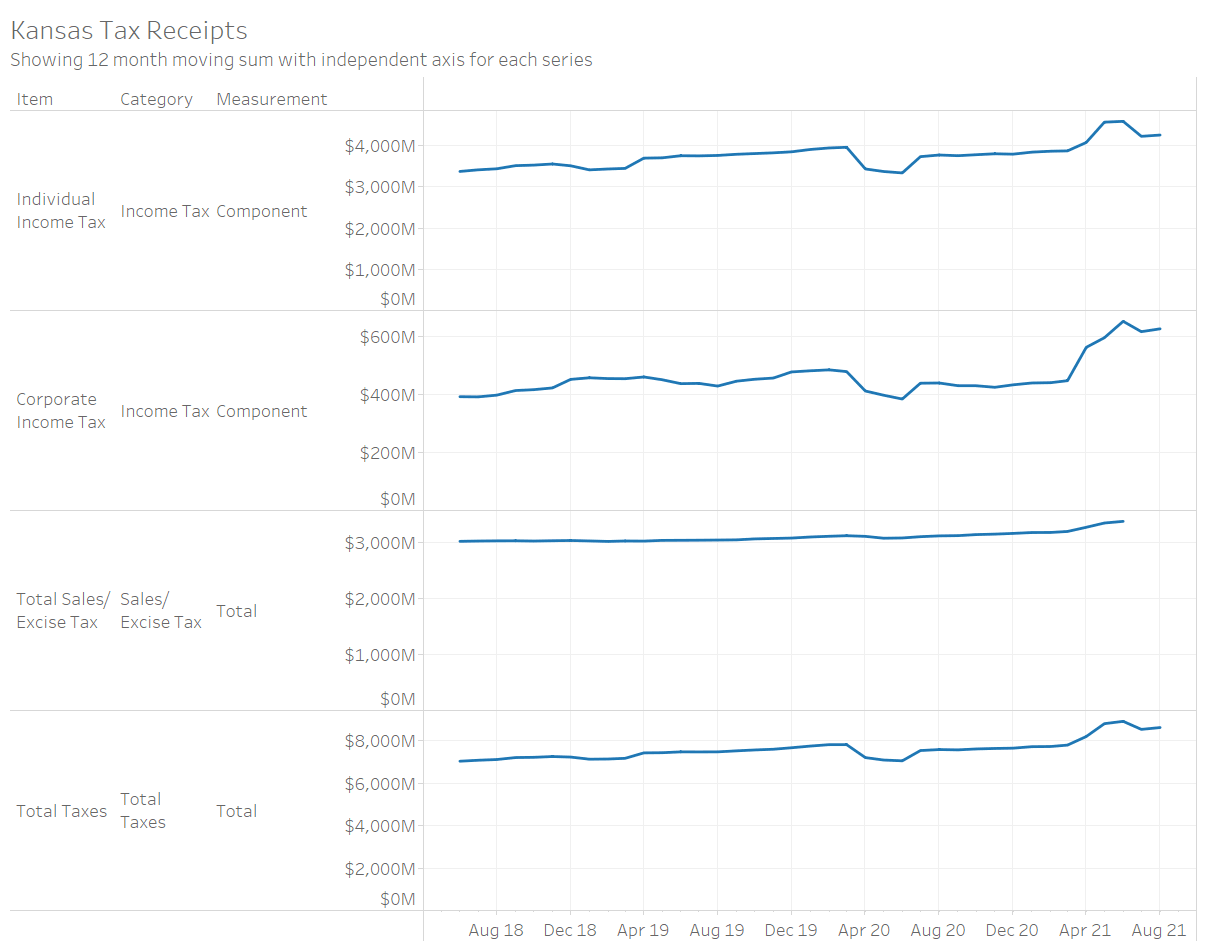
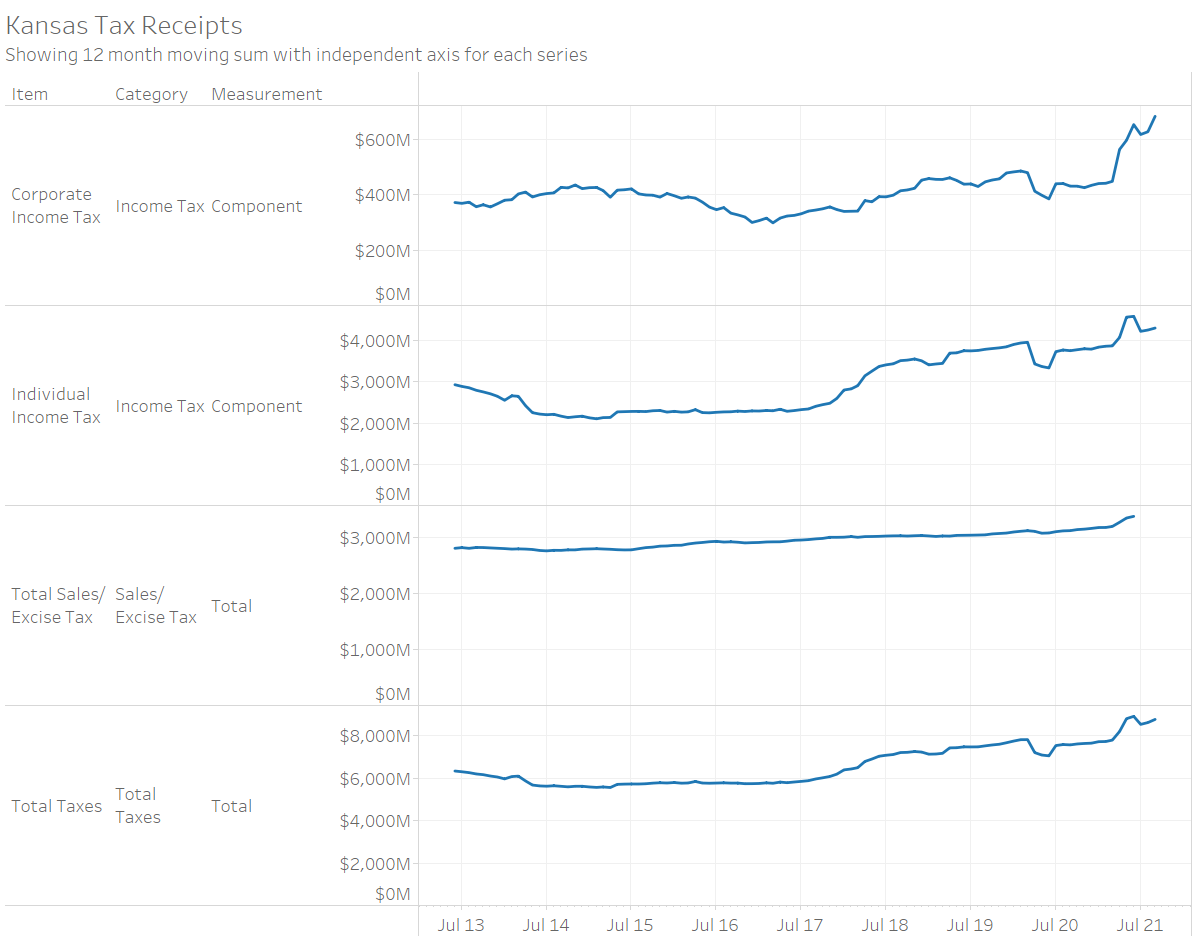
Kansas tax revenue, August 2021
For August 2021, Kansas tax revenue was 15.7 percent greater than August 2020. There are important caveats to consider.