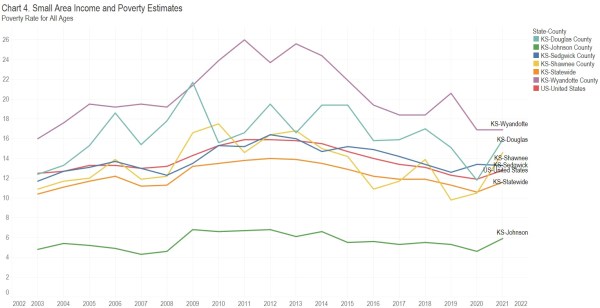
An interactive visualization of household income and poverty data for states and counties.
The United States Census Bureau gathers statistics in the program Small Area Income and Poverty Estimates, or SAIPE. The data for 2021 is now available. I’ve gathered it and created an interactive visualization.
Charts 3 and 4 present median household income and the all-ages poverty rate. I’ve summarized this data in Table 1. This data is not adjusted for inflation.
Considering income, Sedgwick County median household income was greater than both Kansas and the nation in 2003. By 2021, however, both had surpassed Sedgwick County, and by substantial margins. For poverty rate, the Sedgwick County rate increased from 2003 to 2021, while the state of Kansas rose by a much smaller value and the national rate by less. This data is illustrated in the following charts.
To learn more about the data and access the interactive visualization, click here.
Two maps, median household income and poverty rate by county lets us spot trends across the nation.


Leave a Reply