Tag: Economics
-

State of the City, Wichita: The bright future
Wichita Mayor Jeff Longwell’s State of the City video doesn’t seem to be based on reality.
-

Updated: Employment in the States
An interactive visualization of the civilian labor force, employment, and unemployment, for each state. Updated through March 2019.
-

Kansas jobs, March 2019
Employment in Kansas continues to mostly grow in March 2019, but continues a trend of slower growth than the nation.
-
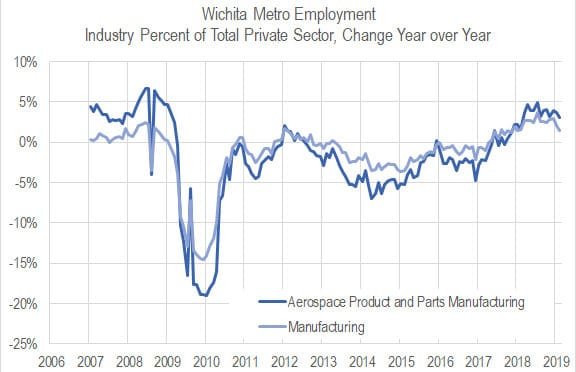
Wichita aerospace manufacturing concentration
Wichita leaders want to diversify the area economy. Has there been progress?
-
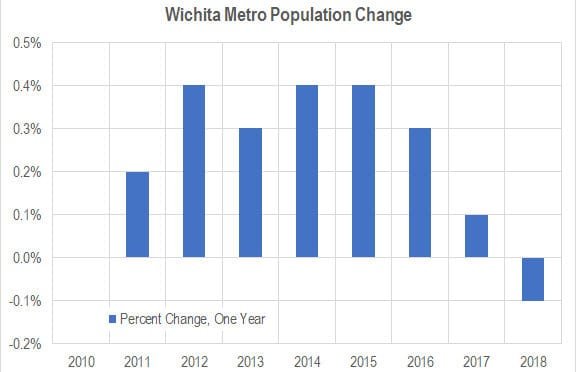
Wichita population falls; outmigration continues
The population of the Wichita MSA fell from 2017 to 2018, and net domestic migration continues at a high level.
-
Wichita jobs and employment, February 2019
For the Wichita metropolitan area in February 2019, jobs are up, the labor force is up, and the unemployment rate is down when compared to the same month one year ago. Seasonal data shows a return to job growth.
-

Kansas personal income
For 2018, the rate of personal income growth in Kansas was near the bottom of the states, although the fourth quarter was much better.
-

Updated: Kansas hotel guest tax collections
Kansas hotel guest tax collections presented in an interactive visualization. Updated through January 2019.
-
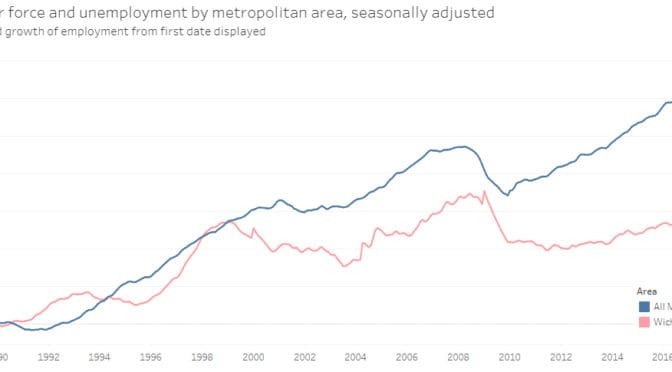
Updated: Metro area employment and unemployment
An interactive visualization of labor force, employment, and unemployment rate for all metropolitan areas in the United States. Updated through January 2019.
-

Kansas jobs, February 2019
Employment in Kansas shows a seasonal decline for February 2019.
-

Wichita considers a new stadium
The City of Wichita plans subsidized development of a sports facility as an economic driver. Originally published in July 2017.
-
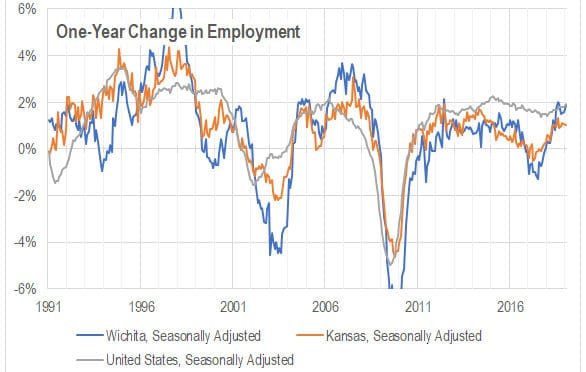
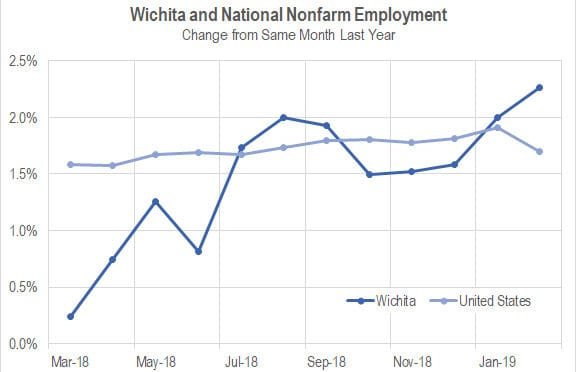
Wichita and national jobs
Growth of employment in Wichita compared to the nation.