Tag: KASB

  • Kansas NAEP scores for 2015

    Kansas NAEP scores for 2015

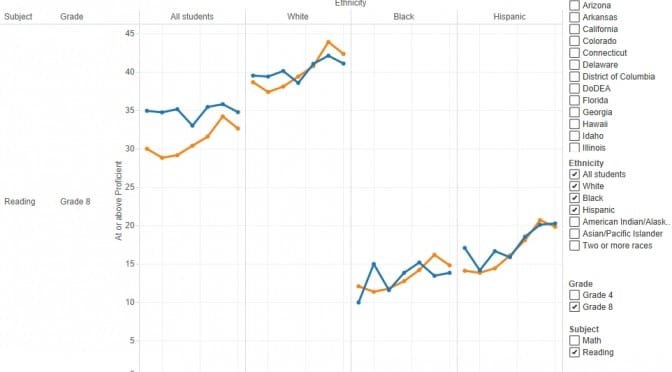
    Reactions to the release of National Assessment of Educational Progress scores for Kansas and the nation. Also, an interactive visualization.

    Results for the 2015 administration of the National Assessment of Educational Progress became available October 28. The test, sometimes called the “nation’s report card,” is described as “the largest nationally representative and continuing assessment of what America’s students know and can do in various subject areas.”

    The Wichita Eagle didn’t have much to say on this, reporting “Results from the latest National Assessment of Educational Progress show that Kansas scores dropped in most areas since 2013, state education officials announced Wednesday. The decreases echo a downward trend in scores nationwide on the NAEP exam, also known as the Nation’s Report Card.”

    The Kansas State Department of Education reported “Results from the 2015 National Assessment of Educational Progress (NAEP) exams, also known as the Nation’s Report Card, show that Kansas followed the national trend of decreasing scores. Across the nation this year, both fourth- and eighth-grade mathematic scores, as well as eighth-grade reading scores, are lower in 2015 than in 2013. Fourth-grade reading scores aren’t significantly different from 2013.”

    The Lawrence Journal-World used the Associated Press story: “Kansas schoolchildren are faring worse on a test known as the nation’s report card. The state’s performance dip follows a national trend of falling scores on the National Assessment of Educational progress.” So too did the Topeka Capital-Journal.

    The Kansas Association of School Boards noted “State and national education leaders, including KASB, are currently researching the latest National Assessment of Educational Progress scores, which were released earlier this week. Both nationally and in Kansas the 2015 NAEP results decreased slightly. … While Kansas results decreased slightly, Kansas student achievement remained above the national average in 4th- and 8th grade math and 8th grade reading and was the same as the national average in 4th grade reading. KASB is currently doing an in-depth analysis of the NAEP results and release its findings as soon as possible.”

    Kansas Governor Sam Brownback issued a statement: “Today’s NAEP scores reflect the need for real education reform to benefit our students. This is a complex issue with no single cause or solution and today’s results confirm a trend showing that even though education funding has increased by more than $1 billion over the past decade, NAEP scores have remained largely flat. … While our Kansas schools remain above the national average, we can and should do more. We want our students to excel and have the skills they need to succeed in school and life in the 21st century. To do that, we must work to get more dollars into the classroom and into the infrastructure our teachers need to improve student performance, particularly in math. We need flexibility at the local level to address students’ needs, and we should support the great efforts of the thousands of teachers who work every day to help give our students opportunity for a brighter future.”

    Some of these statements compared Kansas scores to the national average. That is not appropriate if there are subgroups that score at different levels, and if the composition of these subgroups varies significantly between states or the national average. That is the case with Kansas, which has significantly lower minority populations than the nation and some states. Care must be used when making comparisons.

    To assist in understanding NAEP scores, I’ve updated two interactive visualizations with 2015 data. One visualization shows subgroups based on race/ethnicity, and the other shows subgroups based on national school lunch program eligibility, which is a commonly-used surrogate for income.

    Each visualization has a number of tabs that display data in different ways. Most tabs allow for filtering of data in several ways.

    Click here to access the visualizations.

    Example from the visualization. Click for larger.
    Example from the visualization. Click for larger.
    Example from the visualization. Click for larger.
    Example from the visualization. Click for larger.
  • Kansas school funding growing faster than inflation

    Kansas school funding growing faster than inflation

    Kansas school funding has been growing much faster inflation and enrollment, but for some, it will never be enough, and they will continue to use taxpayer money to press their monetary demands, writes Dave Trabert of Kansas Policy Institute.

    Even by KASB standards, school operating spending is $3.9 billion ahead of inflation

    By Dave Trabert

    A recent blog post by the Kansas Association of School Boards (KASB) Associate Executive Director Mark Tallman says “Total school district funding is, in fact, at an all-time high, expected to top $6.1 billion this year” but “… the part of school funding available for day-to-day operating costs is not keeping up with inflation and enrollment.” There are several misleading aspects to his statement and the data does not support the intended message, but let’s first give credit for the courage to contradict education officials who say funding has been cut. Bravo!

    KASB’s definition of operating costs does not comport with the official definition used by the Kansas Department of Education or the U.S. Department of Education1, but for the sake of argument, let’s say that it’s correct. Let’s also assume that their definition of current operating funding represents the amount needed to efficiently operate schools and achieve the required outcomes, even though the facts refute any such claim.

    By increasing the KASB-defined operating spending for inflation (the calculation for 2006 is $6,928 times (191.41 ÷ 185.14) = $7,162), we find that schools received a lot more money each year than if KASB’s 2005 amount had been increased each year for inflation. The margin of difference is getting closer over the next two years (if one doesn’t count all of the funding), but funding will have exceeded inflation by almost $3.9 billion since 2005.

    KASB uses a different methodology in their inflation analysis. They show prior years’ spending in 2014 inflation-adjusted (constant) dollars; i.e., $X spending in 2014 has the same buying power as $Y in prior years. That methodology is common for restating buying power but it is irrelevant to the question of whether schools are or have been adequately funded.

    The Kansas Constitution says the legislature must make suitable provision for the finance of public education; it does not say that schools must be given whatever they want to spend or that efficient use of taxpayer money cannot be taken into account. The honest truth is that no one knows what schools need to achieve the necessary outcomes while making efficient use of taxpayer money, because no such analysis has ever been undertaken in Kansas. We do know, however, that every Legislative Post Audit has found schools to be operating inefficiently and school superintendents openly acknowledge that they choose to spend more than is necessary in many circumstances. We also know that school districts haven’t even spent all of the money they’ve received over the last ten years, as about $400 million has been used to increase operating cash reserves.

    There may be ways to demonstrate that today’s funding has less buying power than a particular point in time but that doesn’t mean that each year’s funding didn’t keep up with inflation and enrollment — as shown above, per-pupil funding as defined by KASB was $3.9 billion more than an inflationary increase.

    The gap is even greater for total funding, which would have been $6 billion less over the last ten years if per-pupil funding for the 2005 school year had been increased each year for inflation. School districts received large funding increases beginning in 2006 from a Supreme Court Montoy ruling based on a cost study that has since been abandoned by the Supreme Court in Gannon.

    The Shawnee County District Court may believe that schools are not adequately funded, but they ignored the Kansas Supreme Court in arriving at what amounts to little more than a political perspective. School funding has been growing much faster inflation and enrollment, but for some, it will never be enough … and they will continue to use taxpayer money to fund KASB justifications (and attorneys) for their monetary demands.


    1KSDE and the U.S. Department of Education say operating expenditures “…do not include equipment (700 object codes), Capital Outlay or Bond & Interest. [700 object codes include expenditures for acquiring fixed assets, including land or existing buildings; improvements of grounds; initial equipment; additional equipment; and replacement of equipment.]”  The KASB definition also excludes Food Service and employee retirement costs but they don’t disclose that their definition is not the official definition and it also does not comport with the Kansas Supreme Court, which says all funding sources, including retirement costs, should be considered as part of adequate funding.

  • For Kansas schools, a share of your income is the standard

    For Kansas schools, a share of your income is the standard

    If Kansas personal income rises but the school spending establishment doesn’t get its cut, something is wrong, they say.

    A publication by KASB is titled “Despite increases, share of Kansans’ incomes spent on public schools is at a 30-year low.”

    In the document, KASB, the Kansas Association of School Boards, states: “According to new reports released by state agencies, total funding for Kansas school districts will exceed $6 billion for the first time this year. However, when compared to the total income of all Kansans, school spending will be at the lowest level in at least 30 years.”

    This is not the first time KASB has made this argument. It’s a curious and ultimately spurious argument, that even though more will be spent on Kansas schools this year, it’s still not enough, as Kansan’s incomes rose faster than school spending.

    Can we list the reasons why this argument is illogical?

    1. What if Kansas income declined? Would KASB then call for reducing school spending to match? Not likely.

    2. What if the number of students declined? Would KASB then be satisfied with spending less of our income on public schools? I don’t think so.

    3. What if Kansans decided to spend more on private education rather than public education? Would KASB be satisfied if the total spent on education remained constant? Not likely, as KASB is only concerned about public education. Money spent on private education, in fact, is viewed by KASB as money that should have been spent on public schools.

    Another indication of the perversity of this argument is that spending less of a share of our income to obtain a product or service is usually viewed as an advancement, not a situation to be cured. For example in 1929, American households spent 23.4 percent of disposable personal income on food. In 2013 it was 9.8 percent. This is a good thing. We have to work less in order to feed ourselves.

    But to the Kansas school spending establishment, that’s not the way the world should work. If personal income rises, so too should Kansas school spending, they say. This is the entitlement society at work. When KASB writes “Kansas are spending less of their income to fund public education” it’s not meant as a sign of advancement. Instead, it is the Kansas school spending establishment complaining that it isn’t getting its share.

    It’s a risky argument to make. Many Kansans are concerned that school spending rises while the quality of education falls. Kansas school vigorously oppose any sort of market-based reforms to Kansas education, such as school choice or treating teachers like private-sector employees are treated.

    Now, Kansas schools argue that if hard-working Kansans increase their income, schools should get their cut too.

  • School boards in Kansas

    Voice for Liberty Radio 150x150Mark Tallman, associate executive director for advocacy at Kansas Association of School Boards addressed members and guests of the Wichita Pachyderm Club on January 9, 2015. The slides from his presentation are below.

    [gview file=”http://wichitaliberty.org/wp-content/uploads/2015/01/School-Boards-in-Kansas-Mark-Tallman-2015-01-09.pdf”]

  • For McGinn, a liberal voting record is a tradition

    Based on votes made in the Kansas Senate, the advertising claims of Sedgwick County Commission candidate Carolyn McGinn don’t match her record.

    Kansas CapitolIn a radio advertisement, Carolyn McGinn says she is conservative. In a mailer, she touts her “fiscal conservative leadership” in the Kansas Senate.

    But voting records don’t match these claims.

    Several voting scorecards in recent years show Senator McGinn ranking low in terms of voting for economic freedom issues. These issues generally concern taxation, wasteful spending, and unnecessary regulation. In recent years, a freedom index has been produced by Kansas Policy Institute. In 2012 the Kansas Economic Freedom Index was a joint product of Americans for Prosperity-Kansas, Kansas Policy Institute, and myself. In 2010 I produced an index by myself. All tabulations show McGinn rarely voting in favor of economic freedom.

    In the 2014 formulation, McGinn scored 25.8 percent. Four senators (Kansas has 40 senators) had lower scores. Some Wichita-area legislators that had higher scores than McGinn include Senator Oletha Faust-Goudeau and Representatives Ponka-We Victors, Gail Finney, Jim Ward, Tom Sawyer, and Brandon Whipple. All these are Democrats, by the way, and they voted more in favor of economic freedom than did Carolyn McGinn.

    In 2013, McGinn scored 40 percent. Eight senators had lower scores.

    In 2012 the scores were calculated in a different manner. McGinn scored -6, with 16 senators scoring lower.

    There was no index for 2011.

    In 2010, on an index that I produced, McGinn scored seven percent. Three other senators had the same score, and one had a lower score.

    At a recent forum, McGinn criticized the concept of a vote index, telling the audience: “The economic freedom index, I just find that interesting. Because it’s based on amendments after we’re out of session, so you can pick and choose what you want for who.”

    She’s right, in a way. I don’t know what she meant by “amendments,” but the organizations that construct voting scorecards choose votes that they believe distinguish candidates along some axis. Usually the votes are chosen after they’re made, although sometimes organizations “key vote” an issue. That means they alert legislators in advance of a vote that the vote will be included on their scorecard.

    There are organizations that are in favor of more spending, less accountability, and fewer choices for Kansas parents and schoolchildren. They produce scorecards, too. In particular, Kansas Association of School Boards found that McGinn never voted against their position from 2009 to 2012. Kansas National Education Association, while not making a scorecard public, recommended that its members vote for McGinn.

  • Kansas news media should report, not spin

    Kansas news media should report, not spin

    kansas-policy-institute-logoA Hutchinson News editorial contained an uninformed opinion of which special interest groups are working for the best interests of Kansans. Following, Dave Trabert of Kansas Policy Institute explains that influence may be shifting from media, unions, the education establishment, cities, counties, and school boards to those with different views — those of limited government and economic freedom that empower citizens, not an expansive government and its beneficiaries. The editorial referred to is Goodbye Democracy, Hello Wealthocracy.

    Media spin a threat

    By Dave Trabert

    Kansans are bombarded with claims that range from innocently incomplete to quite deliberately false. Increasingly, the media perpetrates this bad information. That behavior limits civil discourse and is a serious threat to personal freedom and our democratic republic.

    Media should use its powerful voice to provide unbiased information. Instead, we see a growing trend in Kansas media to distort the truth, ignore facts and attack those who disagree with their view of the world. A recent Hutchinson News editorial is an example of this petulant behavior.

    The basic premise of “Goodbye Democracy, Hello Wealthocracy” is that elected officials are chosen and kept in line by special interest groups. The author allows that moneyed interests work both sides of the aisle in Washington and in other states but incredibly asserts that this is not the case in Kansas. He says, “Here, the GOP rules, and the split is between those who labor for their constituents and those who pledge allegiance to their sponsors.”

    Even casual political observers know that to be laughably false. Republicans have a paper majority, but even cub reporters know it is meaningless. KPI’s Economic Freedom Index has consistently found Republicans at the top and bottom of rankings based on their votes for economic and educational freedom.

    The dividing line is not party affiliations or labels like liberal, moderate or conservative. Rather, it’s a philosophical belief in the role of government and collectivism versus the personal liberty of individuals.

    There is no such thing as a “wealthocracy,” but special interest groups do influence politics. Claiming this to be the exclusive province of Kansans with a limited government perspective, however, is a conscious lie.

    The behaviors attributed to the Kansas Chamber of Commerce and Americans for Prosperity (recruiting and financially supporting friendly candidates for public office and encouraging elected officials to see things their way) are equally attributable to public employee unions, school board associations and others with big-government views. “Laboring for constituents” is a Hutchinson News euphemism for upholding the self-serving ideals of KNEA, KASB, state employee unions and other institutional interests.

    There is nothing wrong, according to the U.S. Supreme Court, about special interests attempting to influence government. The difference — and perhaps the real objection of The Hutchinson News — is that their “side” is losing its long-standing monopoly over information and, with it, heavy influence over government and citizens.

    The Kansas Policy Institute is perhaps the leading provider in Kansas of factual information on school funding and student achievement. Our information often differs from that published by media, unions and the education establishment, but they are facts nonetheless.

    The editorial said, “… few lobbyists dominate like the Kansas Chamber of Commerce, Americans for Prosperity and the Kansas Policy Institute.” We’re flattered to be considered a dominant force, but the editorial conveniently didn’t mention other dominant players, including cities, counties, school boards and unions. The objection is not to our dominance; it’s that we don’t share the big-government/collectivist perspective of The Hutchinson News.

    We call that hypocrisy.

  • WichitaLiberty.TV: Kansas school finance lawsuit, problems solved?

    WichitaLiberty.TV: Kansas school finance lawsuit, problems solved?

    In this episode of WichitaLiberty.TV: The Kansas Supreme Court handed down its ruling in Gannon v. Kansas, the school finance lawsuit. What did the court say, and did it address the real and important issues with Kansas schools? Episode 37, broadcast March 30, 2014. View below, or click here to view on YouTube.

  • Kansas education topic on ‘This Week in Kansas’

    school-homeworkKansas education issues were a topic on a recent segment of KAKE TV “This Week in Kansas.”

    Opening the show, Representative Jim Ward made a small but potentially consequential mistake when he said the “legislature has violated their constitutional duty to provide for an adequate or sufficient education.”

    The Kansas Constitution actually says this in Article 6, Section 6(b): “The legislature shall make suitable provision for finance of the educational interests of the state.”

    It’s too bad that the Kansas Constitution doesn’t mandate that the state provide an “adequate or sufficient” education, as that would provide the basis for a lawsuit that would actually — potentially — benefit Kansas schoolchildren.

    The performance of Kansas schools that the education establishment touts wilts when examined under a statistical microscope. If we compare Kansas NAEP scores to those of Texas, we have what seems to be four contradictory statements, but each is true.

    • When considering all students: Kansas scores higher than Texas.
    • Hispanic students only: Kansas is roughly equal to Texas.
    • Black students only: Kansas scores below Texas.
    • White students only: Kansas scores below Texas in most cases.

    (For more on this, see Kansas school test scores, in perspective.)

    Furthermore — and this is important considering the significance given to the current school finance lawsuit: At a time when Kansas was spending more on schools due to an order from the Kansas Supreme Court, the state lowered its already low standards for schools.

    That is the conclusion of the National Center for Education Statistics, based on the most recent version of Mapping State Proficiency Standards Onto the NAEP Scales. NCES is the primary federal entity for collecting and analyzing data related to education in the U.S. and other nations, and is located within the U.S. Department of Education and the Institute of Education Sciences.

    The mapping project establishes a relationship between the tests each state gives to assess its students and the National Assessment of Education Progress, a test that is the same in all states. As explained in Kansas school standards and other states, Kansas standards are relatively low, compared to other states. This video explains.

    Sample conclusions of this analysis for Kansas include:

    “Although no substantive changes in the reading assessments from 2007 to 2009 were indicated by the state, the NAEP scale equivalent of both its grade 4 and grade 8 standards decreased.

    Also: “Kansas made substantive changes to its reading grade 8 assessment between 2005 and 2009, and the NAEP scale equivalent of its grade 8 standards decreased.

    In other words, NCES judged that Kansas weakened its standards for reading performance.

    Mark Tallman of Kansas Association of School Boards also appeared. His focus is primarily on spending, but also makes the same mistakes when citing the performance of Kansas schools.

  • Kansas Association of School Boards: Putting institutions and money before individual students

    kansas-association-school-boards-signFrom Kansas Policy Institute.

    Kansas Association of School Boards: Putting institutions and money before individual students
    By Dave Trabert

    There is no question that many students receive a fine public education and go on to success in college or career, but there is also no question that thousands of students are left behind every year. Continuing to pour money into the current broken system — whether ordered to so by courts or by choice — will not close the large achievement gaps that exist for students of color and those from low-income families.

    Yet institutional demands for more money continue to drive the debate. Many mission statements effectively say “it’s all about the kids” but in reality, the wants of institutions and the adults in the system often prevail over student needs.

    A recent blog post from Mark Tallman and the Kansas Association of School Boards (KASB) is loaded with more examples of institutions misrepresenting the facts of student achievement and school funding to justify the extraction of more money from taxpayers.

    Here’s the first example. “KASB research has shown that the percentage scoring at Basic is a good indicator of the state’s graduation rate, i.e. the percentage of students who complete high school. The percentage scoring at Proficient is a rough indicator of the percentage of students who will meet college readiness benchmarks on the ACT test. In other words, the percent at Basic might be considered the percentage of student “on track” to graduate, and the percent at Proficient indicates those “on track” to be ready for college-level academics.”

    First of all, a high school graduation rate says nothing about actual achievement.  In fact, the Kansas Board of Regents reports that 30 percent of 2011 Kansas high school graduates who attended a public college in Kansas actually signed up for remedial training – keep in mind that students voluntarily sign up for these courses and cannot be made to do so by the college. These students apparently know that they aren’t ready to take credit-bearing courses in college.  Also, only 30 percent of the 2013 class who took the ACT test scored high enough to be considered college-ready in English, Reading, Math and Science. (Incredibly, KASB representative Tom Krebs testified earlier this year that the ACT college-readiness measure shows that local school districts are doing a good job — because only 30 percent of today’s jobs require a 4-year degree!)

    Also, the KASB research that purports to find ‘good indications’ is called a bivariate analysis, meaning that only two variables are considered. This reminds me of something the late Senator Daniel Patrick Moynihan (D-NY) once said with tongue firmly planted in cheek. He noted that northern states tended to have the best student achievement, so we should move schools closer to the Canadian border to improve achievement. His point was that simple bivariate analyses and non sequiturs are no substitution for honest analysis. A bivariate analysis doesn’t control for other factors that may (and frequently do) make a difference.

    Note also that KASB continues to lower the bar and now often speaks of the percentage of students at Basic+ instead of Proficient+ on the National Assessment of Educational Progress (NAEP).  They referenced high rankings on Proficient+ until people became aware that Kansas’ proficiency levels are in the 30 percent and 40 percent range. Now they talk about Basic+ so they can use higher percentages and make the institutions look better.

    Example #2

    On October 7, Mr. Tallman wrote, “KASB absolutely agrees that differences in student characteristics must be considered in evaluating educational performance … the most important factor .. is socio-economic status.”

    But that “belief” is largely ignored on October 11 when he writes, “To measure overall state performance, we calculate the average of the percentage of students scoring at both Basic and Proficient on the four tests (Grade 4 reading and math; Grade 8 reading and math). We then rank the average percent for each state.” Two of the four percentages he averaged are based on All Students, which brings the mostly-White states to the top of his list. You see, students of color are two to three years’ worth of learning behind White students, so the states with highest overall average performance are those with the lowest levels of minorities. (This is the essence of Senator Moynihan’s observation.)

    Similar achievement gaps exist between low income students and others. And since Census data shows that minorities are twice as likely to live in poverty as Whites, KASB’s deliberate decision to not control for race and income produces very predictable results that are favorable to their overall point (it’s all about the money). Every state in the KASB calculation of the Top Ten states in Reading and Math has Free and Reduced Lunch Eligibility levels below the national average of 48.1 percent. Most of them are well below. The point of KASB’s exercise is of course about money. The states chosen to appear in their top ten all spend more than Kansas.

    Example #3

    “The State Board of Education has continued to set higher standards.” That’s a real whopper.  Our research shows how and when the Kansas State Board of Education chose to reduce performance standards, to the point where the U.S. Department of Education reports that Kansas has some of the lowest performance standards in the nation. Before publishing our findings, we asked KSDE and KBOE to let us know if there was anything factually incorrect in our work. They didn’t respond.

    Example #4

    “Economic data indicates Kansas must increase the percentage of high school graduates and college-ready students to meet future employment needs and provide “middle class” incomes.” It’s true that people with more education are able to earn more money but that speaks to the important of getting an education. It has nothing to do with the amount taxpayers are expected to spend on public education.

    Example #5

    “New national reports have indicated Kansas has further reduced spending compared to most states.” This is a reference to a bogus claim made by the Center on Budget and Policy Priorities, which we completely de-bunked in a separate blog post. CBPP does not publish their data; they only share their “conclusions.” Our request to see their data has gone unanswered. Meanwhile, KSDE data shows that new records for school funding were set in 2012 and 2013 and are predicted to be broken again in 2014.

    Example #6

    This final example represents the culmination of all the previous misrepresentations. “The totality of the evidence indicates that funding does play an important role in state student achievement and that it will be extremely difficult — and, in fact, unprecedented — for Kansas to improve achievement on NAEP results without additional revenues.” The data, however, tells a much different story.

    No change on NAEP scores despite a 32 percent inflation-adjusted increase in per-pupil spending since 1998 (even with all KPERS spending removed, it’s still a 29 percent increase).

    ACT scores are flat overall, although White scores slightly increased over the last ten years while scores for Hispanic and African American students are flat or down a bit. ACT doesn’t publish income-based scores.

    And after nearly $3 billion in targeted At Risk (low income) spending, there’s virtually no improvement in those students’ achievement.

    Yep … it’s all about the money. It’s all about demands to put more money into a system despite voluminous evidence that large funding increases have not closed student achievement gaps and roughly half of all Kansas students are clearly not leaving high school ready for college or careers.

    These large achievement gaps do not exist because those students cannot learn, but because they do not have equal access to educational opportunities. Kansas has tried ‘throwing money at the problem’ and it has not worked. Until elected officials and citizens support implementation of student-focused funding and other policy initiatives, they are tacitly choosing to place a higher priority on institutional wants than on student needs.

    P.S.  We’re working with legislators and school districts to show how a lot more money can be made available to classrooms by improving district efficiency. It costs a lot of money to fund public education, but it’s how the money is spent that matters … not how much.