Following are visualizations of data. Many are interactive and created using Tableau Public. In some cases I’ve recorded myself using the visualization to tell a story, and all you have to do is watch.
Kansas school employment rose for the current school year.
Figures released by the Kansas State Department of Education show the number of teachers and certified employees rose for the 2019-2020 school year.
The number of Pre-K through grade 12 teachers rose to 31,337 from 31,153, an increase of 0.59 percent. Certified employees rose to 43,305 from 42,861, or by 1.04 percent. 1 These are not the only employees of school districts. 2
Enrollment rose from 476,482 to 477,032, or 0.12 percent. As a result, the ratio of teachers to students was unchanged (measured to two decimal places), and the ratio of certified employees to students fell.
The relative change in enrollment and employment is not the same in every district. To help Kansas learn about employment trends in individual school districts, I’ve gathered the numbers from the Kansas State Department of Education and present them in an interactive visualization. Click here to use it.
According to KSDE, certified employees include Superintendent, Assoc./Asst. Superintendents, Administrative Assistants, Principals, Assistant Principals, Directors/Supervisors Spec. Ed., Directors/Supervisors of Health, Directors/Supervisors Career/Tech Ed, Instructional Coordinators/Supervisors, All Other Directors/Supervisors, Other Curriculum Specialists, Practical Arts/Career/Tech Ed Teachers, Special Ed. Teachers, Prekindergarten Teachers, Kindergarten Teachers, All Other Teachers, Library Media Specialists, School Counselors, Clinical or School Psychologists, Nurses (RN or NP only), Speech Pathologists, Audiologists, School Social Work Services, and Reading Specialists/Teachers. Teachers include Practical Arts/Vocational Education Teachers, Special Education Teachers, Pre-Kindergarten Teachers, Kindergarten Teachers, Other Teachers, and Reading Specialists/Teachers. See Kansas State Department of Education. Certified Personnel.http://www.ksde.org/Portals/0/School%20Finance/reports_and_publications/Personnel/Certified%20Personnel%20Cover_State%20Totals.pdf. ↩
There are also, according to KSDE, non-certified employees, which are Assistant Superintendents, Business Managers, Business Directors/Coordinators/Supervisors, Other Business Personnel, Maintenance and Operation Directors/Coordinators/Supervisors, Other Maintenance and Operation Personnel, Food Service Directors/Coordinators/Supervisors, Other Food Service Personnel, Transportation Directors/Coordinators/Supervisors, Other Transportation Personnel, Technology Director, Other Technology Personnel, Other Directors/Coordinators/Supervisors, Attendance Services Staff, Library Media Aides, LPN Nurses, Security Officers, Social Services Staff, Regular Education Teacher Aides, Coaching Assistant, Central Administration Clerical Staff, School Administration Clerical Staff, Student Services Clerical Staff, Special Education Paraprofessionals, Parents as Teachers, School Resource Officer, and Others. See Kansas State Department of Education. Non-Certified Personnel Report.http://www.ksde.org/Portals/0/School%20Finance/reports_and_publications/Personnel/NonCertPer%20Cov_St%20Totals.pdf. ↩
Kansas tax receipts by category, presented in an interactive visualization. Now with data through December 2019.
The Kansas Division of the Budget publishes monthly statistics regarding tax collections. I’ve gathered these and present them in an interactive visualization.
In the nearby example from the visualization, we can see the rising trend in individual income taxes, due to the a increase passed by the Kansas Legislature.
Click here to learn more and access the visualization.
While government spending rises, private domestic investment declines.
Recent data on the American economy shows that private investment is in a slump, while government contributions to GDP are rising. Even before the release of the figures for the fourth quarter of 2019, this trend was noticed.
In October, the Wall Street Journal reported: “What is driving the U.S. expansion? Consumers and government spending, according to a close look at Wednesday’s report on third-quarter economic output. A Trump administration priority — business investment — is lagging behind, while trade, another priority, is producing mixed results.” 1
Real gross private domestic investment. Click for larger.The Journal article notes the spending boost during the Trump administration: “Mr. Trump has twice reached agreements with Congress to boost spending beyond budget caps enacted during the Obama years, adding to the fiscal stimulus that was applied with tax cuts.”
Then, the same article notes the trend in business investment: “Corporate tax rate reductions were meant to spur business investment, but that isn’t happening. Business investment has expanded at a 4.2% annual rate since Mr. Trump’s election, a slowdown from the 5.2% annual rate that prevailed before it.” Data since the publication of this article shows business investment in what can only be described as a recession.
The interactive visualization I’ve created shows gross domestic product by major sector: Personal consumption, gross private domestic investment, next exports of goods and services, and government. It is easy to see the decline in private investment and the rise in government.
The GDP figures are real, meaning adjusted for inflation. They are annual numbers through 2018. The release this month also includes revisions for the prior year. In the case of Wichita, the revision was significant. See Wichita economy shrinks, and a revision for details.
A nearby example from the visualization compares Wichita metro GDP growth to that of the nation’s metropolitan areas.
Click here to learn more and access this visualization.
Click for larger.Example from the visualization. Click for larger.
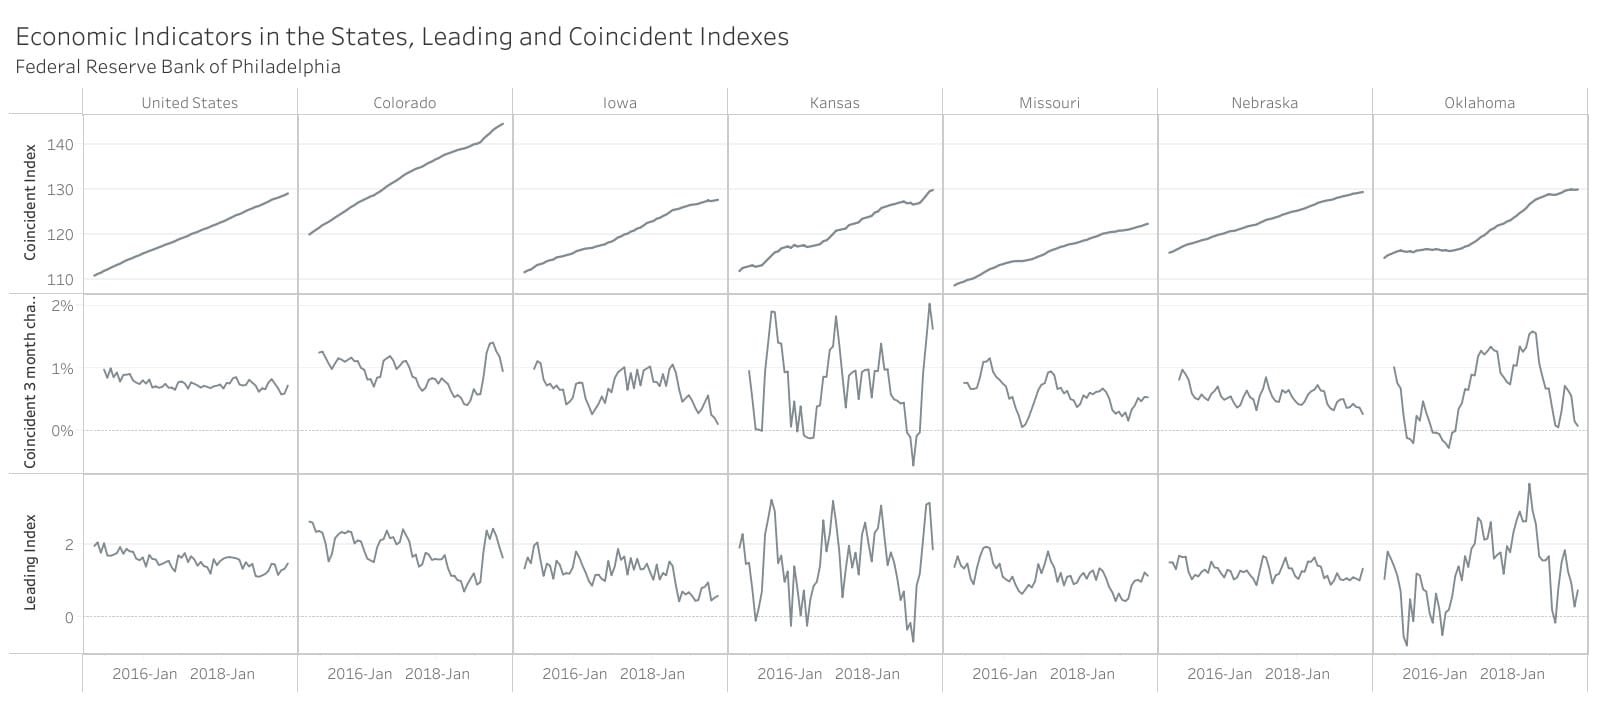
Economic indicators in the states, an interactive visualization.
The Federal Reserve Bank of Philadelphia calculates two indexes that track and forecast economic activity in the states and the country as a whole. Values are available through September 2019.
The coincident index is a measure of current and past economic activity for each state. The leading index predicts the six-month growth rate of the state’s coincident index. Positive values mean the coincident index is expected to rise in the future six months, while negative values mean it is expected to fall. (For more detail, see Visualization: Economic indicators in the states.)
For Kansas, the coincident index has been on a mostly upward trend over the past year, although it has leveled for the past few months.
The leading index has been rising, although it fell sharply in September.
A nearby chart shows index values for the last five years for Kansas, some nearby states, and the United States. You can access the visualization and create your own charts here: Visualization: Economic indicators in the states.
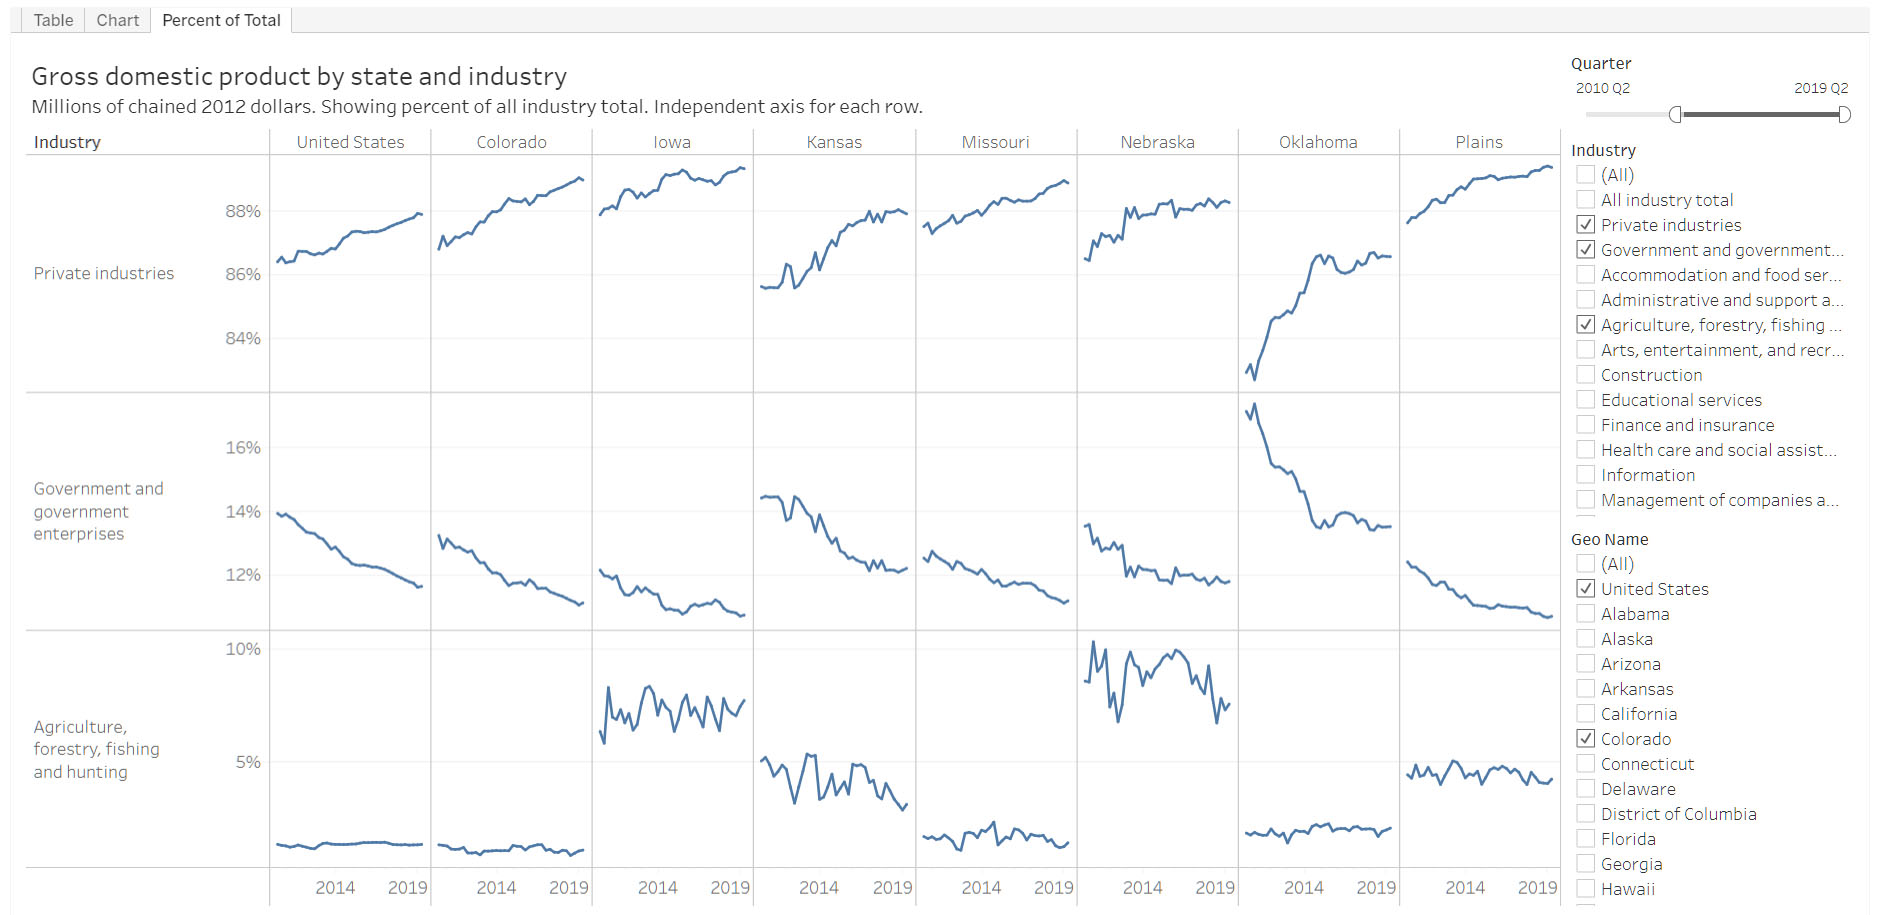
Examining changes in GDP and industry contribution in Kansas.
The interactive visualization Quarterly Real Gross Domestic Product by state and industry holds real (inflation-adjusted) GDP data for states and industries. In the visualization, one presentation shows the contribution to a state’s GDP by each industry.
The nearby example taken from the visualization shows data for Kansas and nearby states, as well as the nation. The industry “Government and government enterprises” contributes a large portion of Kansas GDP, more than any of the illustrated states except Oklahoma. This is consistent with Kansas having many government employees as compared to other states. 1
Click for larger.
We see that the industry “Agriculture, forestry, fishing and hunting’ is prominent in Kansas compared to the nation, although both Iowa and Nebraska are more reliant on this industry. Kansas is roughly equal to the Plains states in this regard. Note that agriculture is volatile.
In the table, we see the change in GDP calculated in two ways: First, the change from the previous quarter, and then from the same quarter of the previous year. For Kansas, for all industries, we see that for the first quarter of 2019, the change in GDP was -0.27 percent. This is consistent with the revision of that quarter’s GDP growth to -1.1 percent on an annual basis. 2 The second-quarter GDP was better, rising by 0.54 percent, again consistent with the 2.2 percent annual rate recently reported.
Click for larger.
For Kansas in 2018, the year-over-year GDP changes for each quarter were 1.09, 2.21, 2.62, and 2.31 percent. For 2019, the quarterly changes have been 0.82 and 0.60 percent, illustrating slower growth in the Kansas economy. This can also be seen in the chart of nonfarm employment changes in Kansas. 3 For the first three months of 2019, the rate of job growth was declining, and then rising in the second quarter.
“In the second quarter of 2019, the Kansas economy grew at the annual rate of 2.2 percent, up from a revised -1.1 percent the previous quarter.” Weeks, Bob. Kansas GDP. Available at https://wichitaliberty.org/economics/kansas-gdp-2019-q2/. ↩