Tag: Economics
-
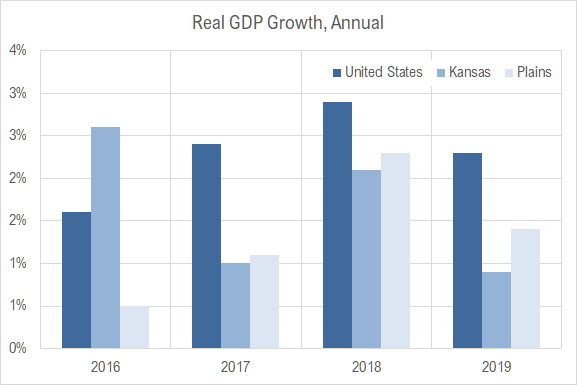
Kansas GDP
In 2019, the Kansas economy grew at the annual rate of 0.9 percent, down from 2.1 percent the previous year, and ranked forty-fifth among the states.
-

Small area income and poverty estimates
An interactive visualization of household income and poverty data for states and counties.
-
Kansas tax revenues not yet affected
Through the end of March 2020, Kansas state tax revenues have not seen the effect of the economic slowdown due to COVID-19.
-
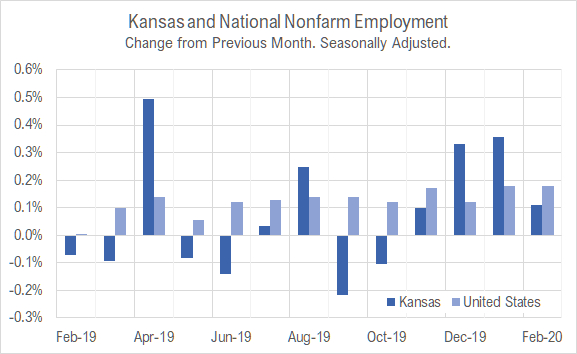
Kansas jobs, February 2020
Employment and the labor force rose in Kansas in February 2020 compared to the prior month, although employment growth was smaller.
-

Kansas personal income
For 2019, the rate of personal income growth in Kansas was near the middle of the states.
-

Wichita jobs and employment, January 2020
For the Wichita metropolitan area in January 2020, the labor force is up, the number of unemployed persons is down, the unemployment rate is down, and the number of people working is up when compared to the same month one year ago. Seasonal data shows increases in labor force and jobs from December.
-
Kansas jobs, January 2020
Employment and the labor force rose in Kansas in January 2020 compared to the prior month. Kansas outperformed the nation in job growth the past two months.
-

Private investment declines
While government spending rises, private domestic investment declines.
-
Updated: Wichita, Kansas, and National Employment
A visualization of national, Kansas, and Wichita nonfarm employment series. Updated with data through December 2019.
-

Wichita jobs and employment, December 2019
For the Wichita metropolitan area in December 2019, the labor force is up, the number of unemployed persons is down, the unemployment rate is down, and the number of people working is up when compared to the same month one year ago. Seasonal data shows small increases in labor force and jobs from November.
-
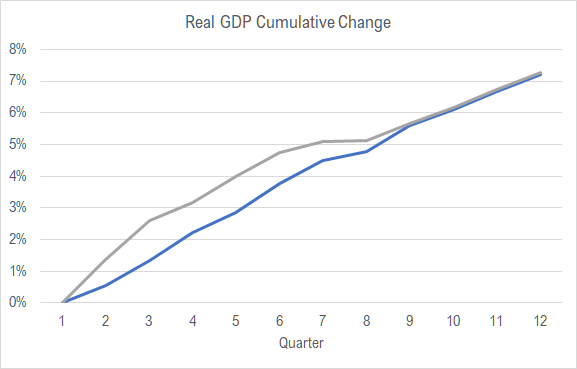
Trump economy continues to grow
There is no doubt that the United States economy has grown since Donald J. Trump became president. How does the growth compare with the previous administration?
-

Trump economy creates jobs
There is no doubt that the United States economy has created many jobs since Donald J. Trump became president. How does the record compare with the previous administration?