Following are visualizations of data. Many are interactive and created using Tableau Public. In some cases I’ve recorded myself using the visualization to tell a story, and all you have to do is watch.
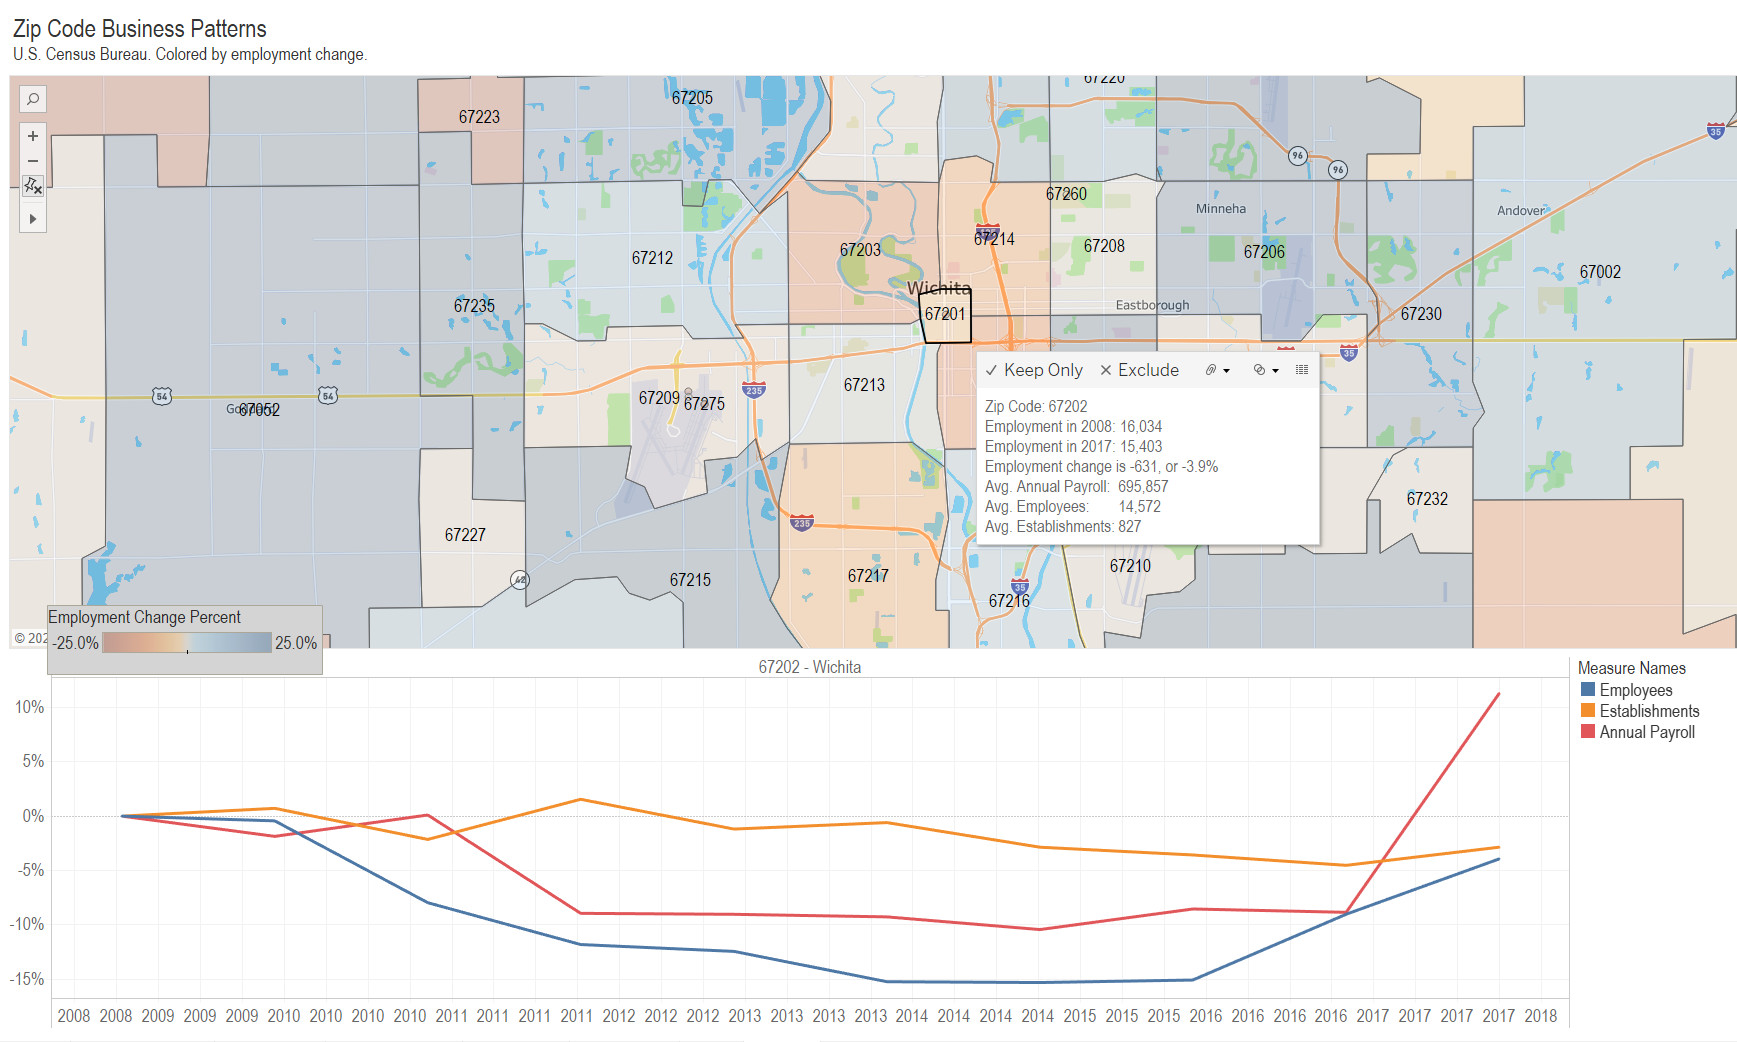
Employment, establishment count, and annual payroll presented in an interactive visualization.
In the program County Business Patterns (CBP), the United States Census Bureau produces estimates of business activity. Data regarding employment, establishment count, and annual payroll is available for several geographies, including zip codes. I’ve gathered this data and present it in an interactive visualization.
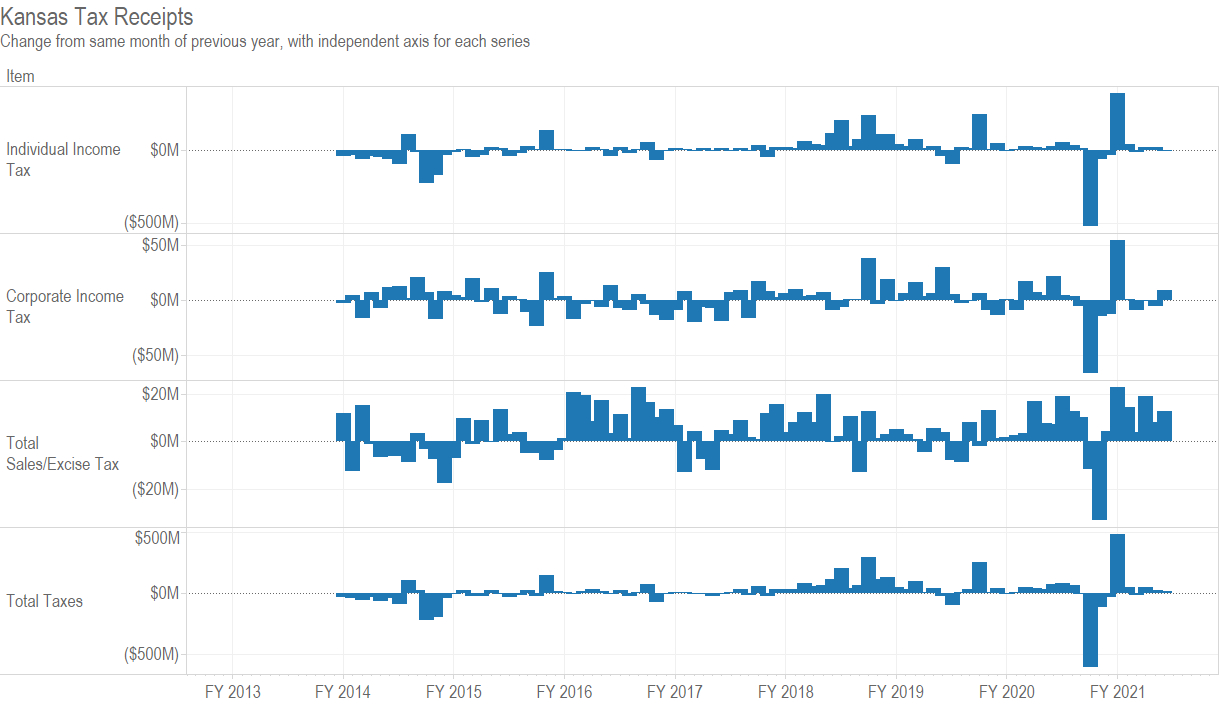
For December 2020, total Kansas tax revenue was 1.8 percent greater than last December 2019. Over the six months of the current fiscal year, tax revenue is 16.6 percent higher than at the same point of the previous fiscal year.
State government tax revenue has generally recovered since the second quarter.
Data from the United States Census Bureau shows that state government tax revenue has largely rebounded since the pandemic.
The data, which is from the Quarterly Summary of State & Local Tax Revenue program, is now available for the third quarter of 2020, which is the months of July, August, and September. In this article and the accompanying charts and visualizations, I present state collections only.
Considering Kansas, total state tax collections in the first quarter were $2,730 million. That dipped to $2,452 million in the second quarter (April, May, and June) as the pandemic — or, rather, the response to the pandemic — affected the economy. In the third quarter, collections rebounded to $2,770, which is slightly more than the first quarter.
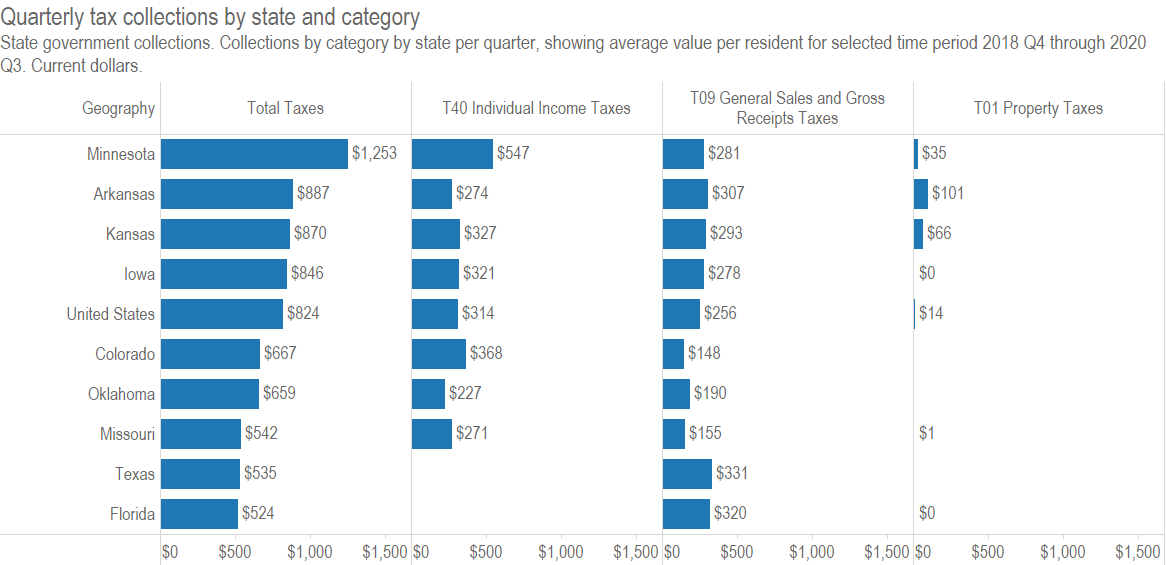
This pattern is common for many states, and appears in the totals for the nation. The nearby illustration shows Kansas, the nation, and nearby states.
Click for larger.
Another chart illustrates that Kansas state government taxes are relatively high when expressed on a per resident basis.
Compared to the nation and surrounding states, Kansas is growing slowly. An interactive visualization.
Each year the United States Census Bureau releases population estimates for the United States. Today, the Bureau released estimates for state populations as of July 1, 2020.
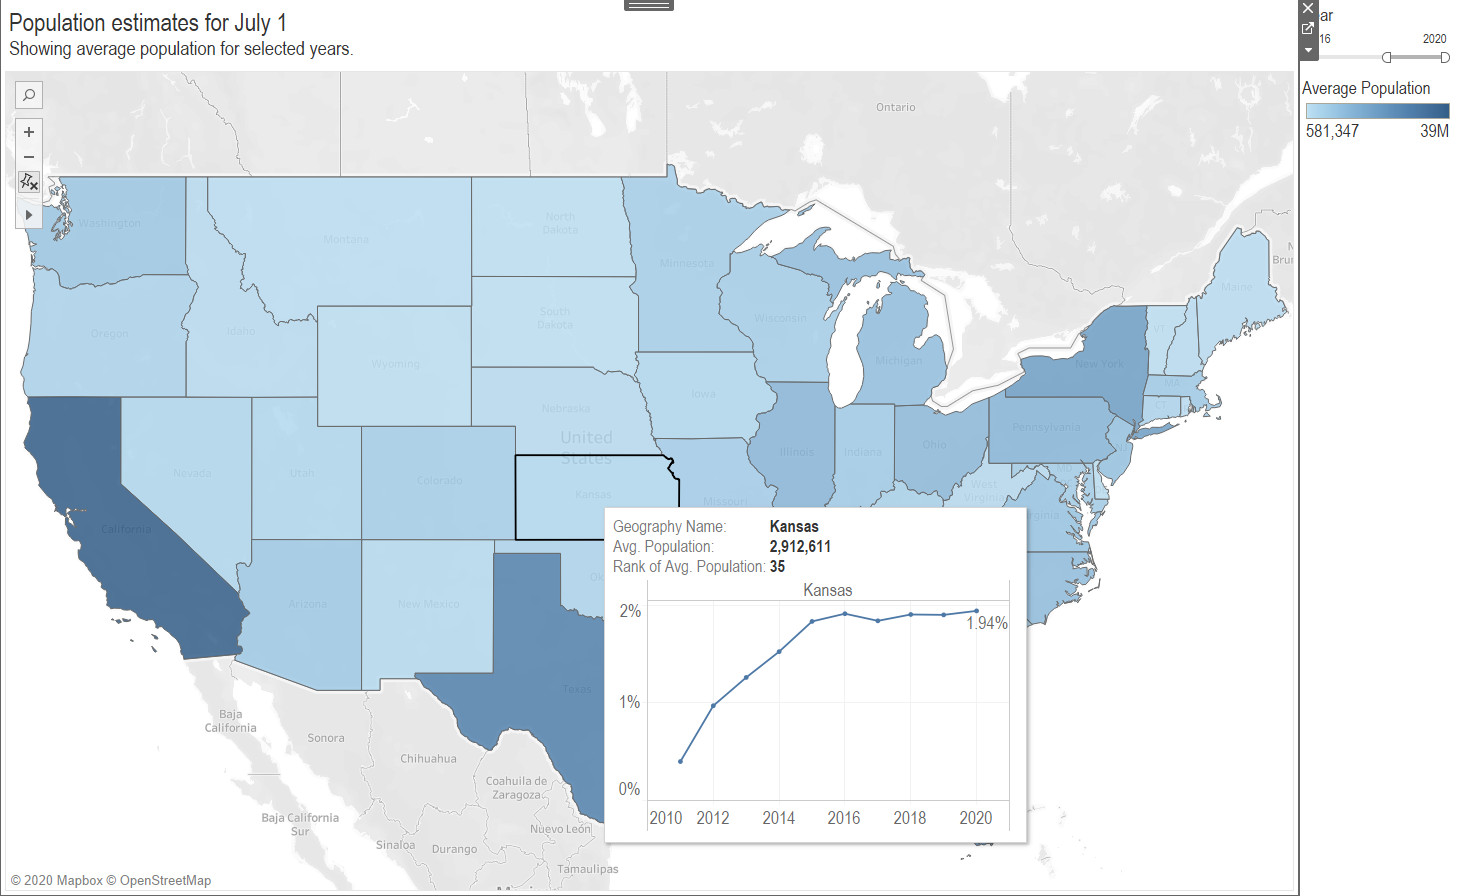
I present this data, along with associated computations of my own, in an interactive visualization. The nearby example shows data for Kansas as of July 1, 2020.
While Kansas is approaching three million in population, it will take many years to reach that benchmark. The estimated population of Kansas is 2,913,805 persons, growing by 1,170 persons (0.04 percent) from 2019. This rate of growth is slow, ranking number 33 among the states. The nearby chart of the rate of population growth in Kansas shows growth is flat in recent years, and below a selection of surrounding states.
Click for larger.
To learn more about the data and access the interactive visualization, click here.
When adjusted for regional differences, per capita personal income in Wichita is relatively high. In recent years growth in per capita and total personal income has been slow, but better in 2019.
The Bureau of Economic Analysis, a division of the United States Department of Commerce, generates personal income data for the nation, the states, and metropolitan statistical areas, or MSAs. Today BEA released data for 2019, and I present the metro data in an interactive visualization.
When presenting economic data, the term “real” commonly means that dollar amounts have been adjusted for the effects of inflation. That is the case for this data. BEA goes further in also adjusting data for regional price parity and personal consumption expenditures price index.
The difference when using values adjusted for regional differences can be substantial. For example, when considering per capita personal income in 2019 using current, non-adjusted dollars, Wichita ranks number 113 among the nation’s 384 metropolitan areas. When adjusted for region, Wichita ranks number 56.
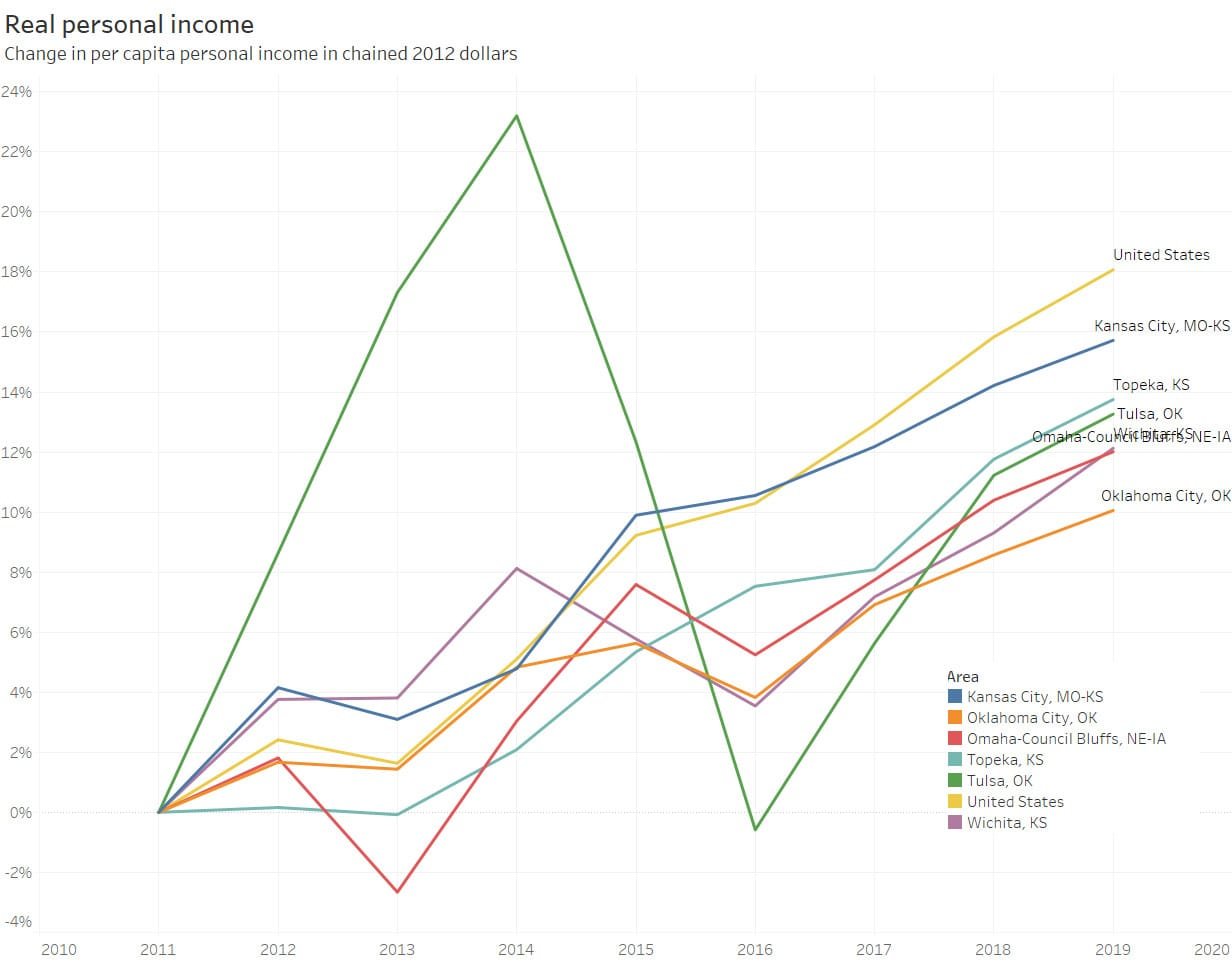
In the example for some nearby metro areas, Wichita’s per capita personal income is near the middle at $54,460. But since 2011, Wichita per capita personal income has grown slowly, rising by 12 percent while the national value grew by 18 percent. For the same period, total personal income in Wichita grew by 15 percent, while the nation grew by 24 percent. For Wichita, 2019 was an improvement from 2018.
Click for larger.Click for larger.Click for larger.
To learn more about this data and access the interactive visualizations, click here.
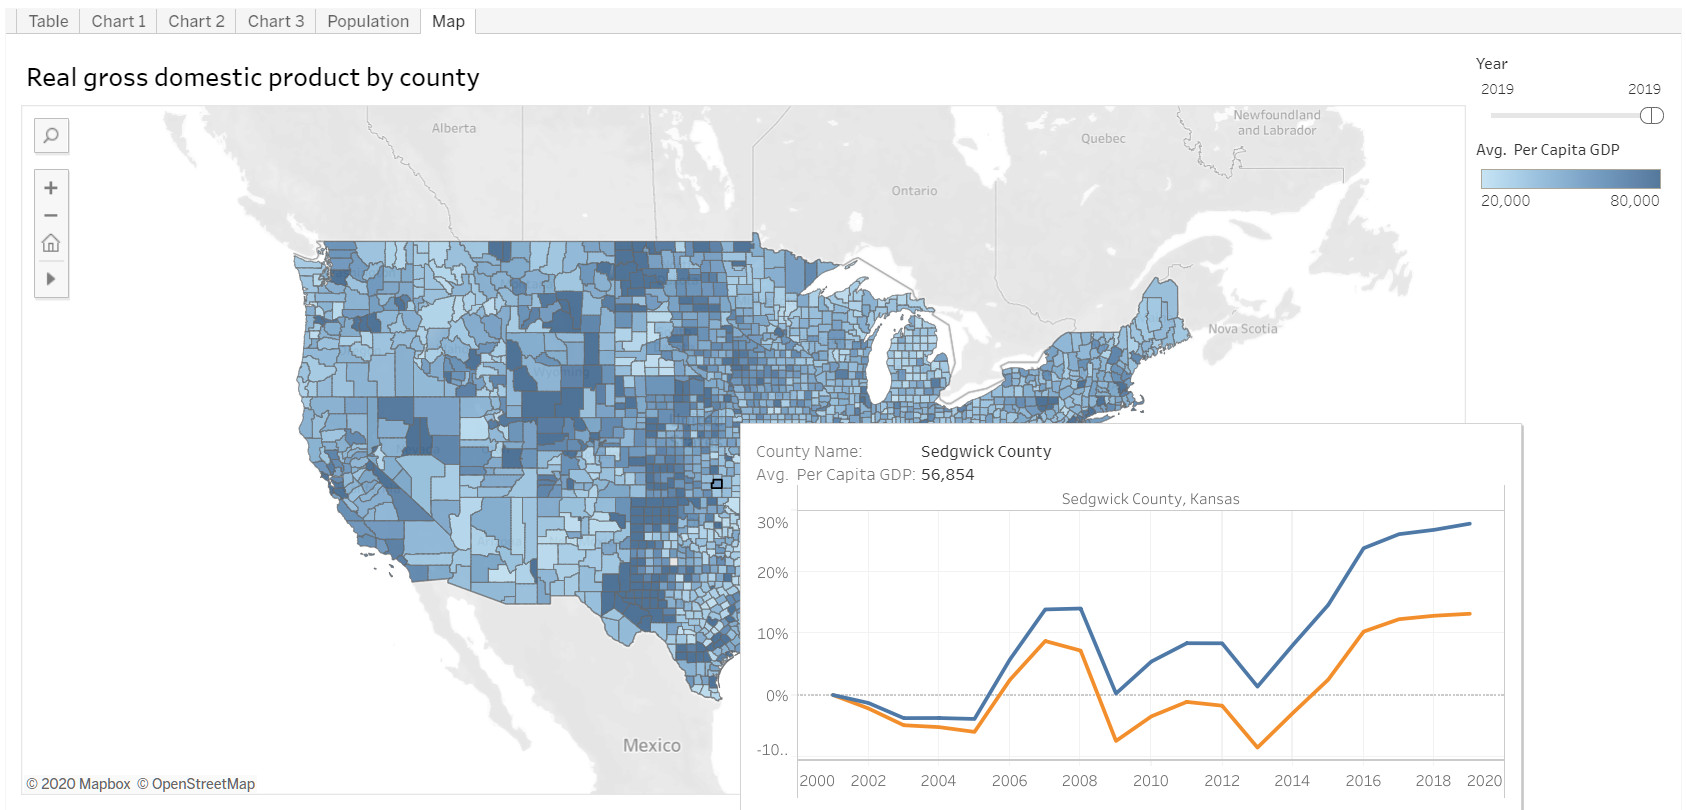
According to BEA, “Real gross domestic product (GDP) increased in 2,484 counties, decreased in 612 counties, and was unchanged in 17 counties in 2019.”
A nearby example shows real GDP per capita for some large Kansas counties.
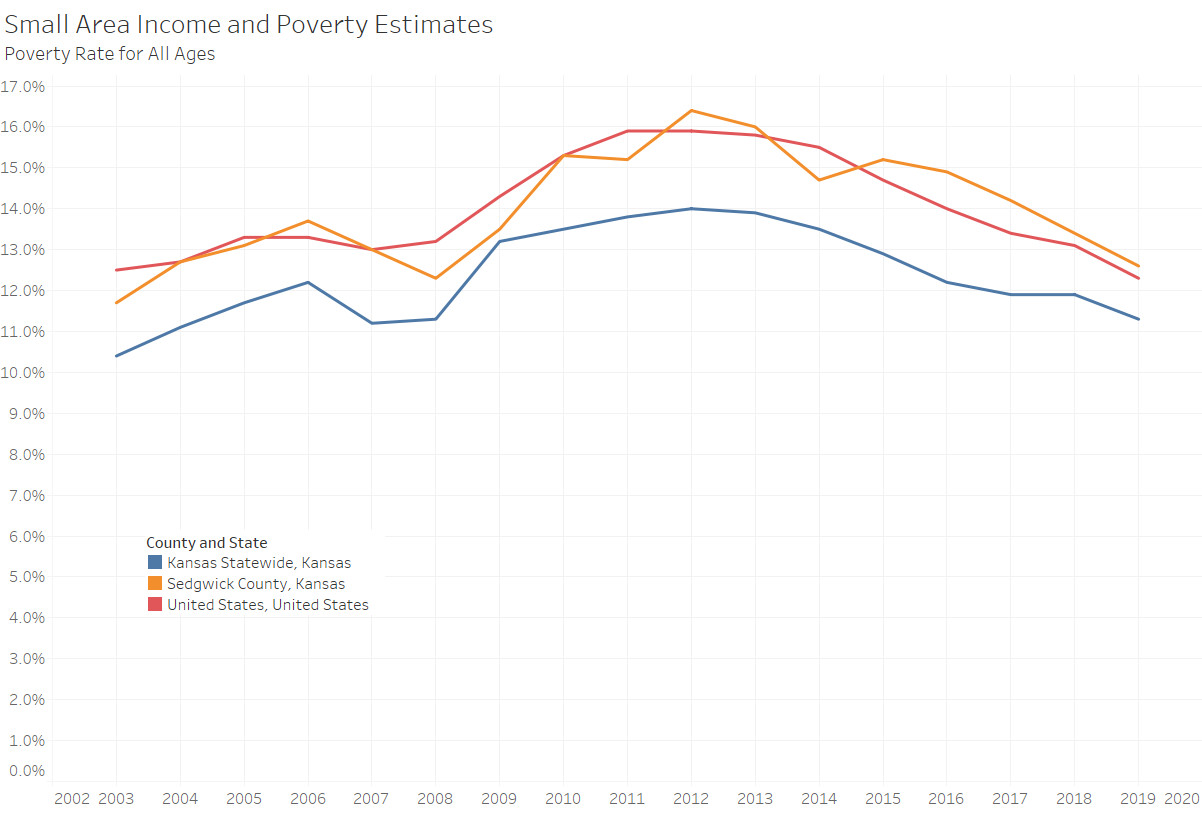
In the nearby example showing the poverty rate for Sedgwick County, Kansas, and the United States, we see that poverty rates have declined since the end of the Great Recession. We also see that the poverty rate for Sedgwick County and the nation trend closely, and both are higher than the statewide rate for Kansas.
Click for larger.
Of note: This data ends with the calendar year 2019, so the effects of the pandemic had not yet happened.
This interactive visualization presents median household income and all-ages poverty rate and population for states and counties.
Click here to learn more and access the interactive visualization. Data is available in tables, charts, and maps.