Tag: Visualizations
-
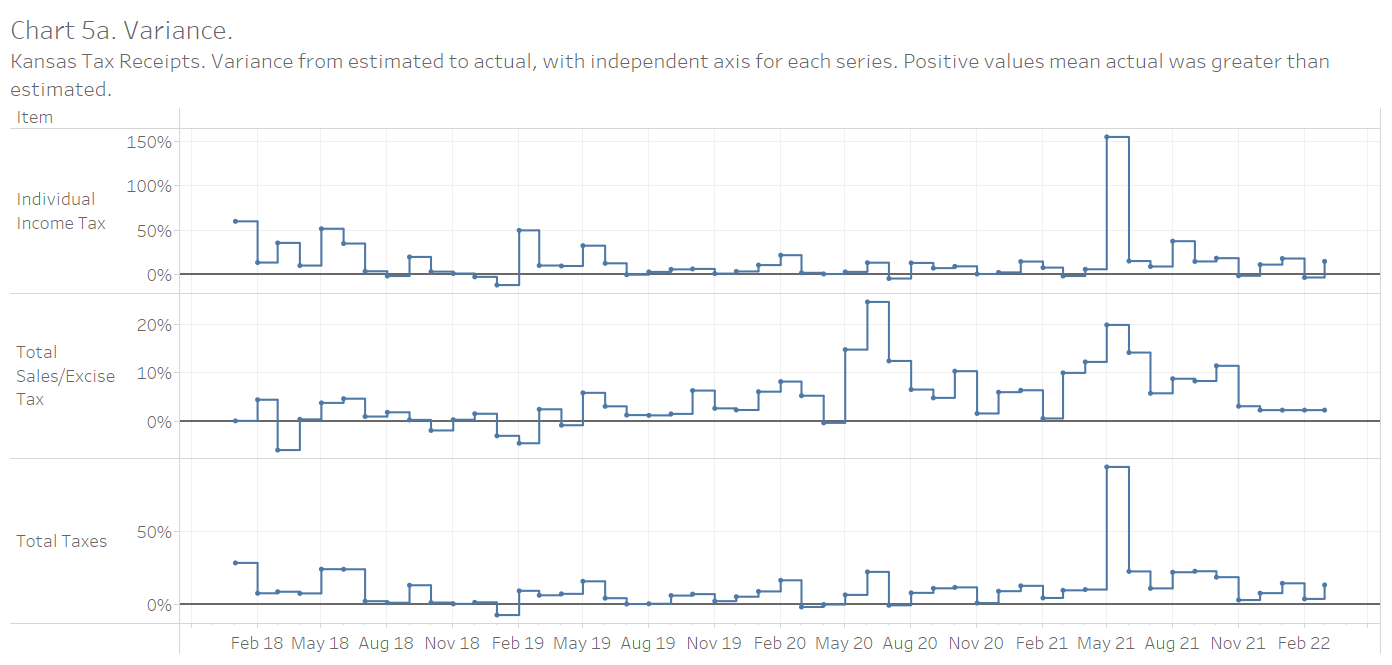
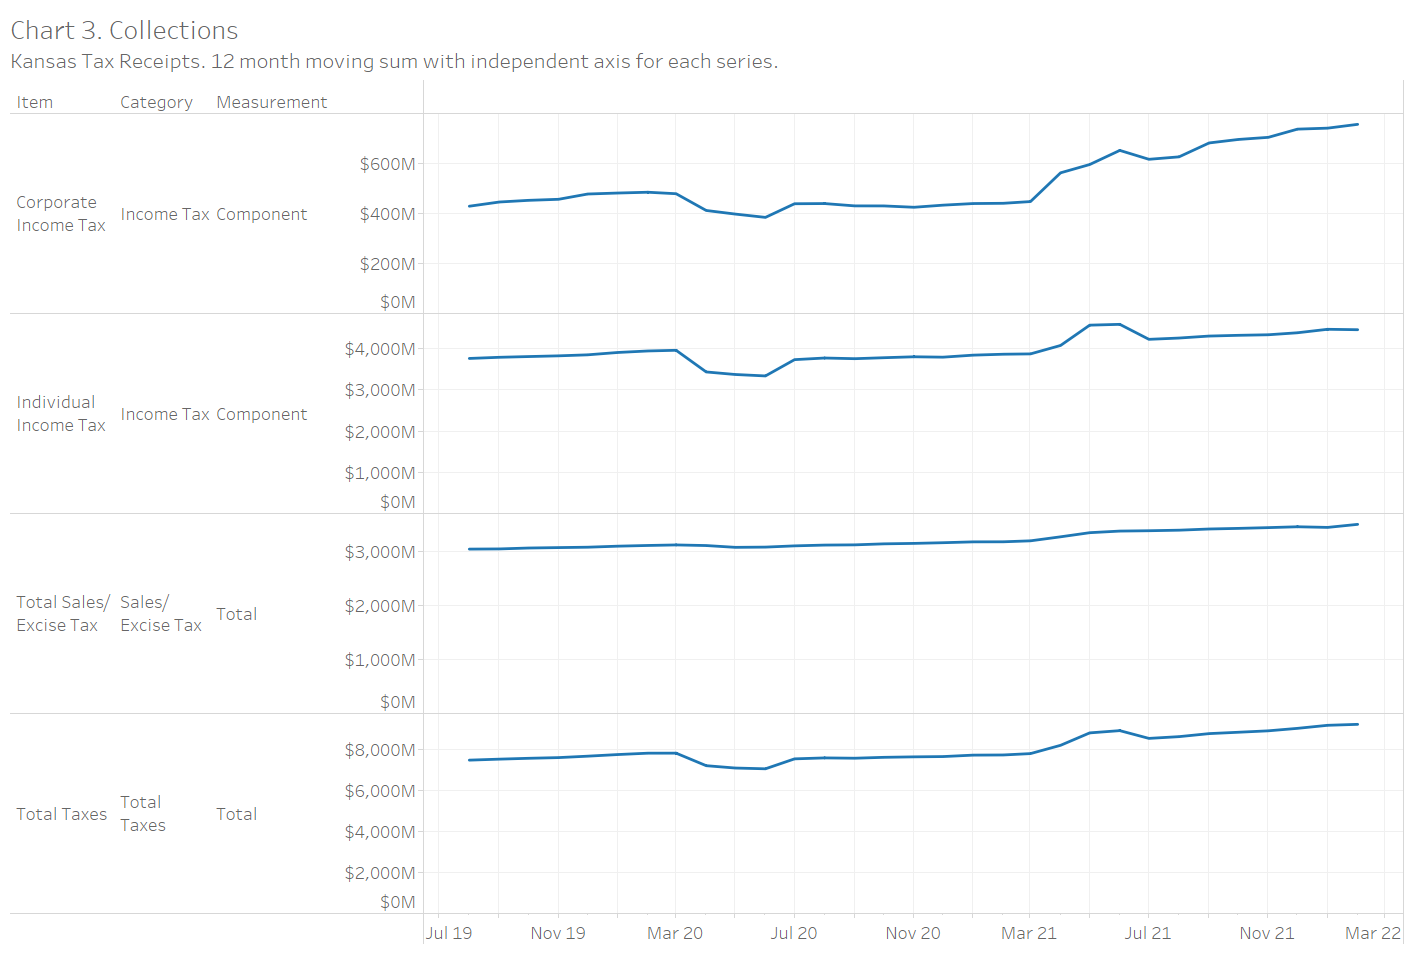
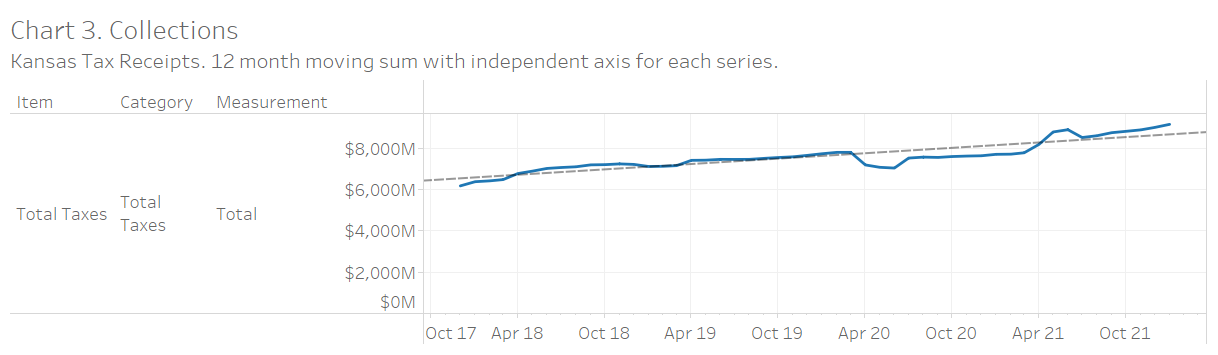
Kansas Tax Revenue, March 2022
For March 2022, Kansas tax revenue was 15.2 percent greater than March 2021, and collections for the fiscal year are 6.6 percent greater than the prior year.
-
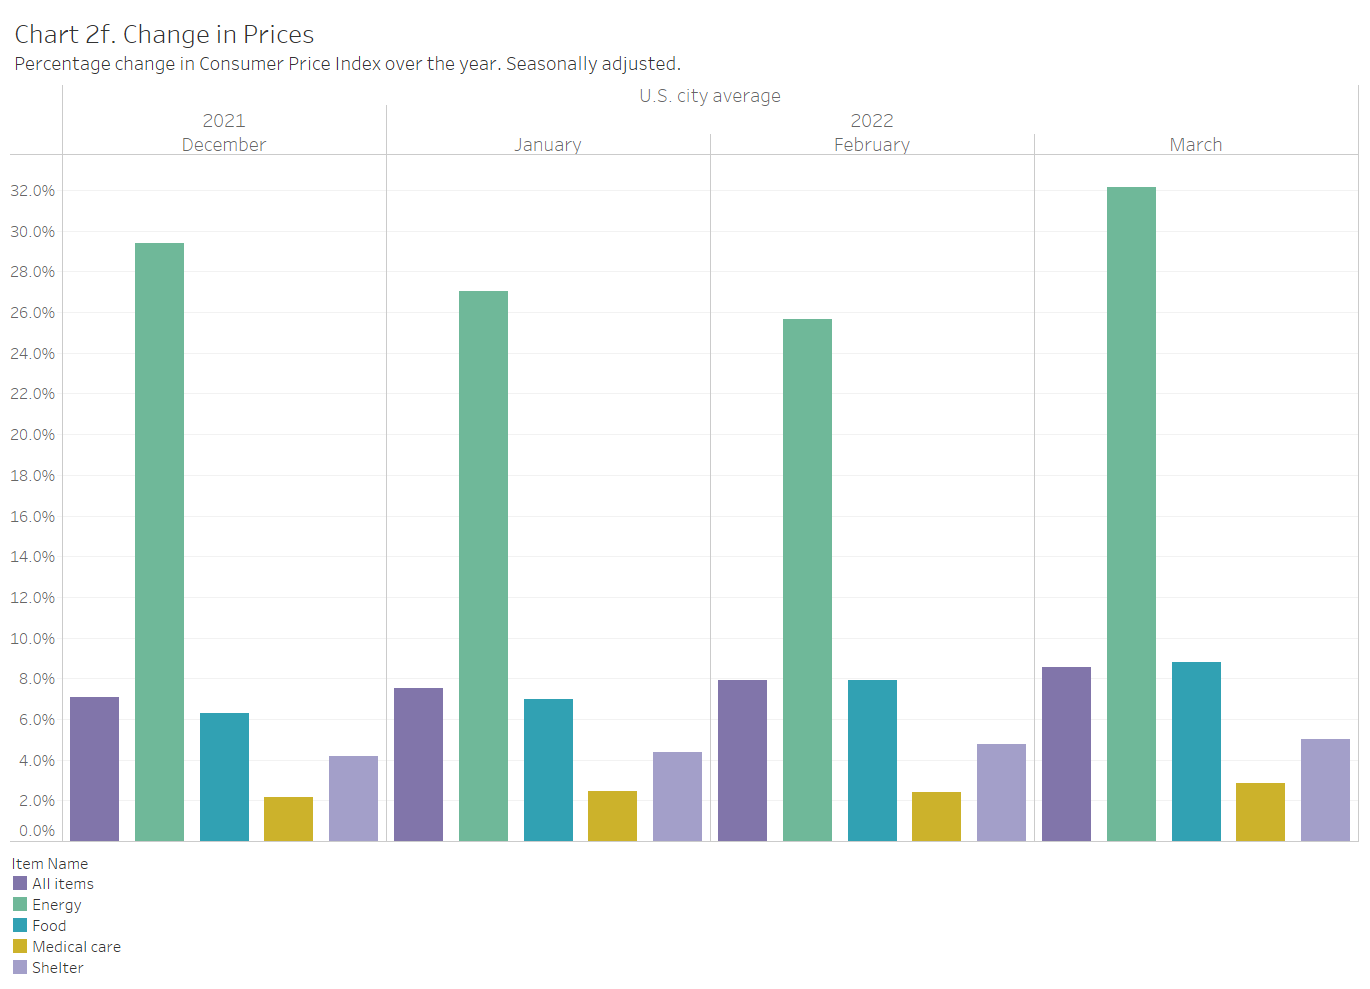
Inflation high and rising in March
As measured by the Consumer Price Index, inflation remained high in March 2022, and the rate accelerated.
-
Monthly State Tax Collections
Tax collections by states, collected monthly by the Census Bureau.
-
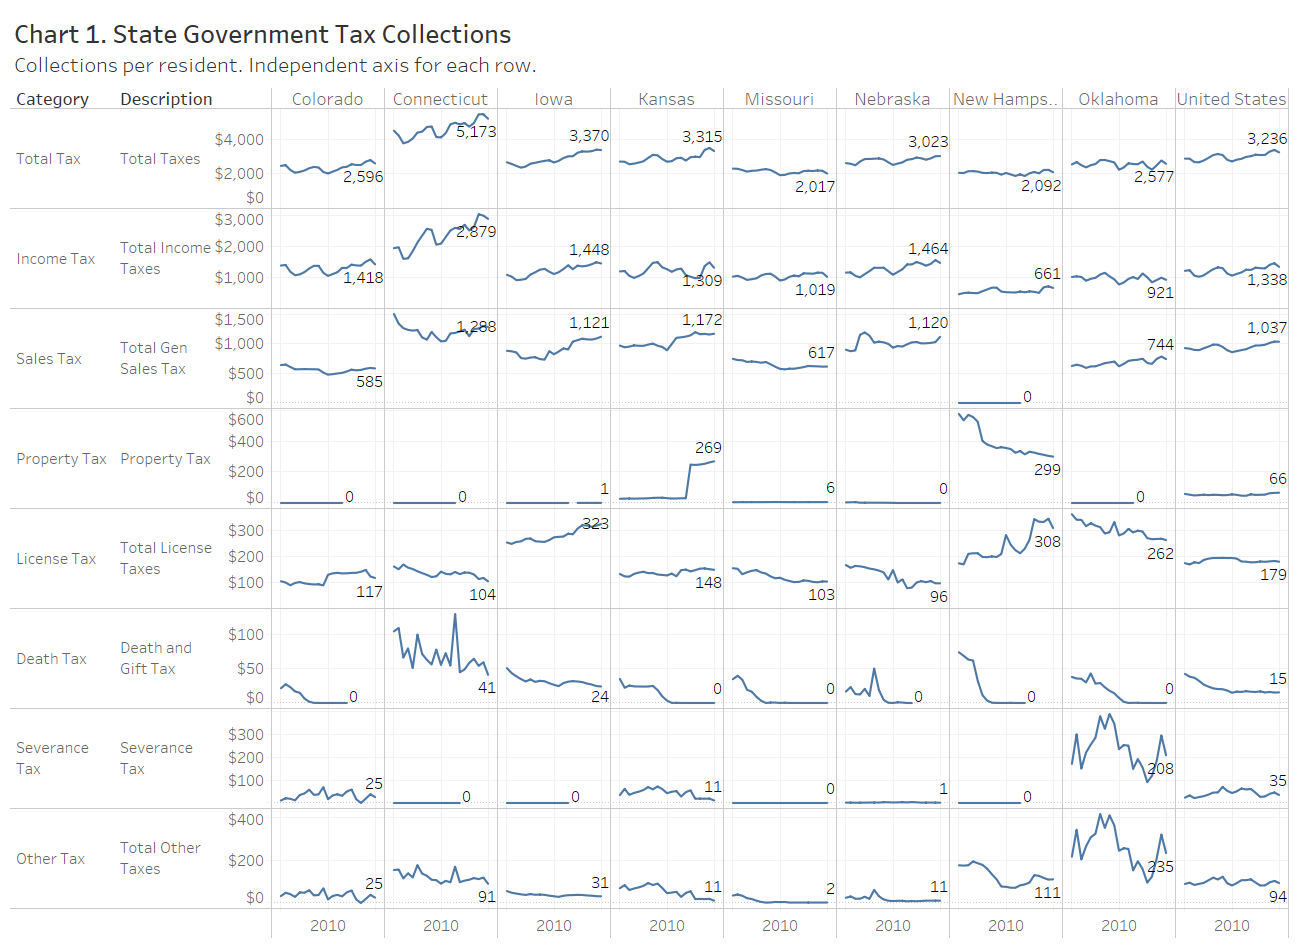
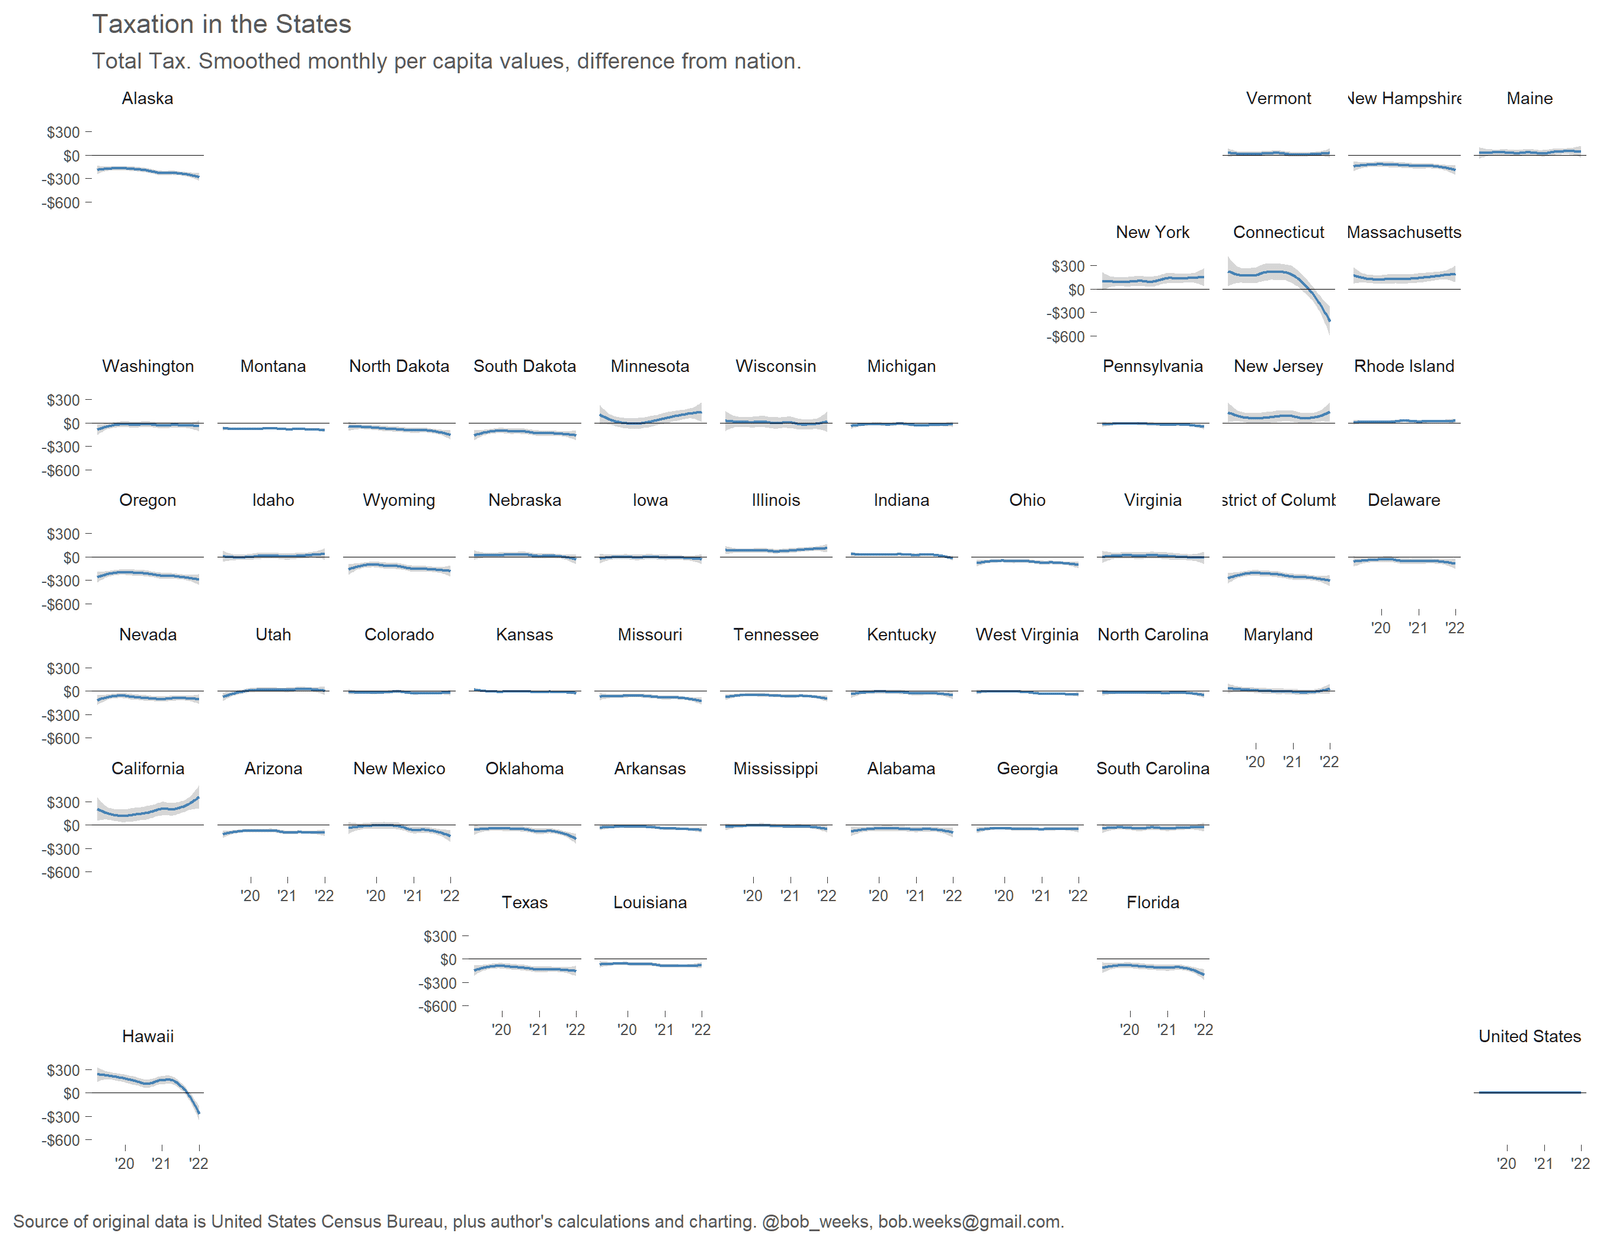
Kansas State Government Tax Collections for 2020
Kansas state government tax collections fell to $3,315 per person in 2020, a decrease of 4.9 percent from 2019.
-
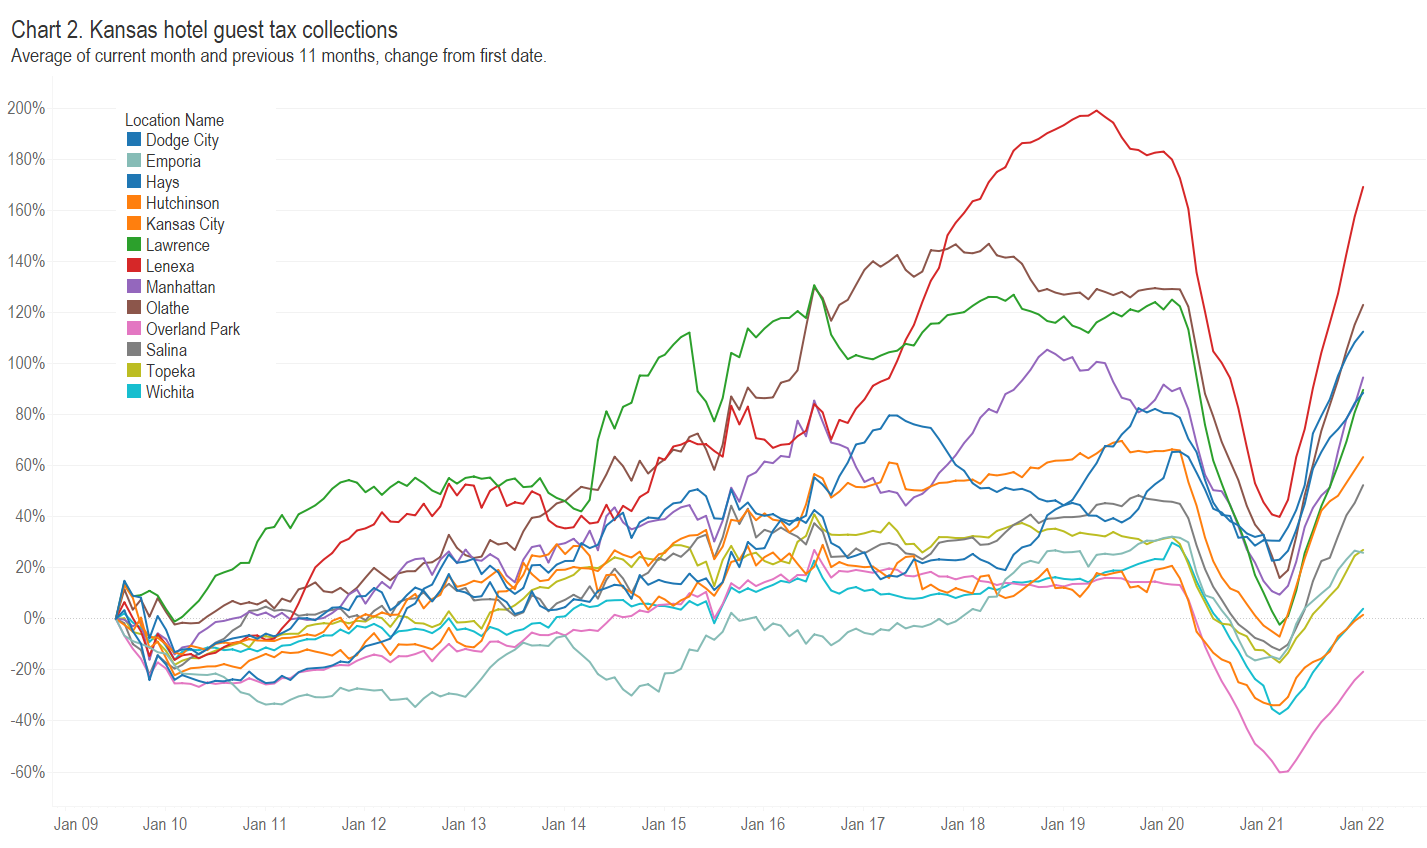
Updated: Kansas hotel guest tax collections
Kansas hotel guest tax collections presented in an interactive visualization. Updated with data through January 2022
-
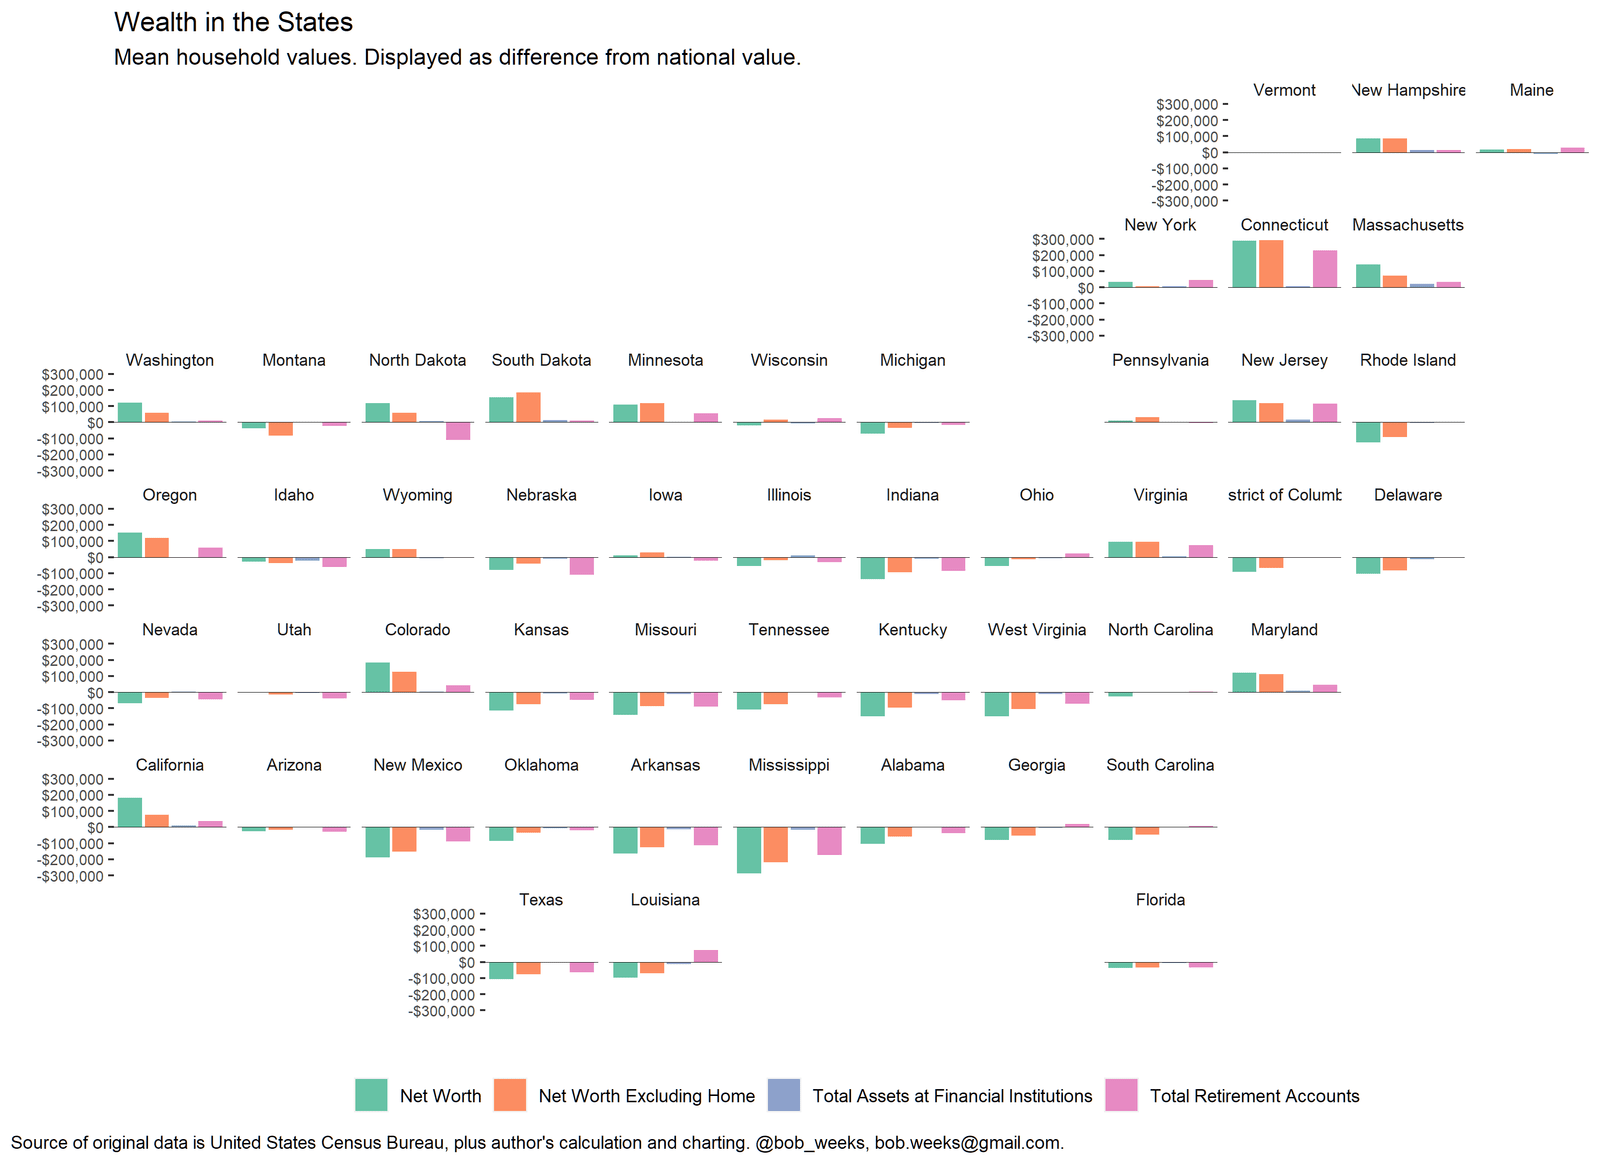
Wealth in Kansas and the States
How does Kansas compare in measures of household wealth?
-
Kansas Tax Revenue, February 2022
For February 2022, Kansas tax revenue was 5.3 percent less than February 2021 and down 46.8 percent from January 2022.
-

Inflation still high in January
As measured by the Consumer Price Index, inflation remained high in January 2022, and the rate accelerated.
-
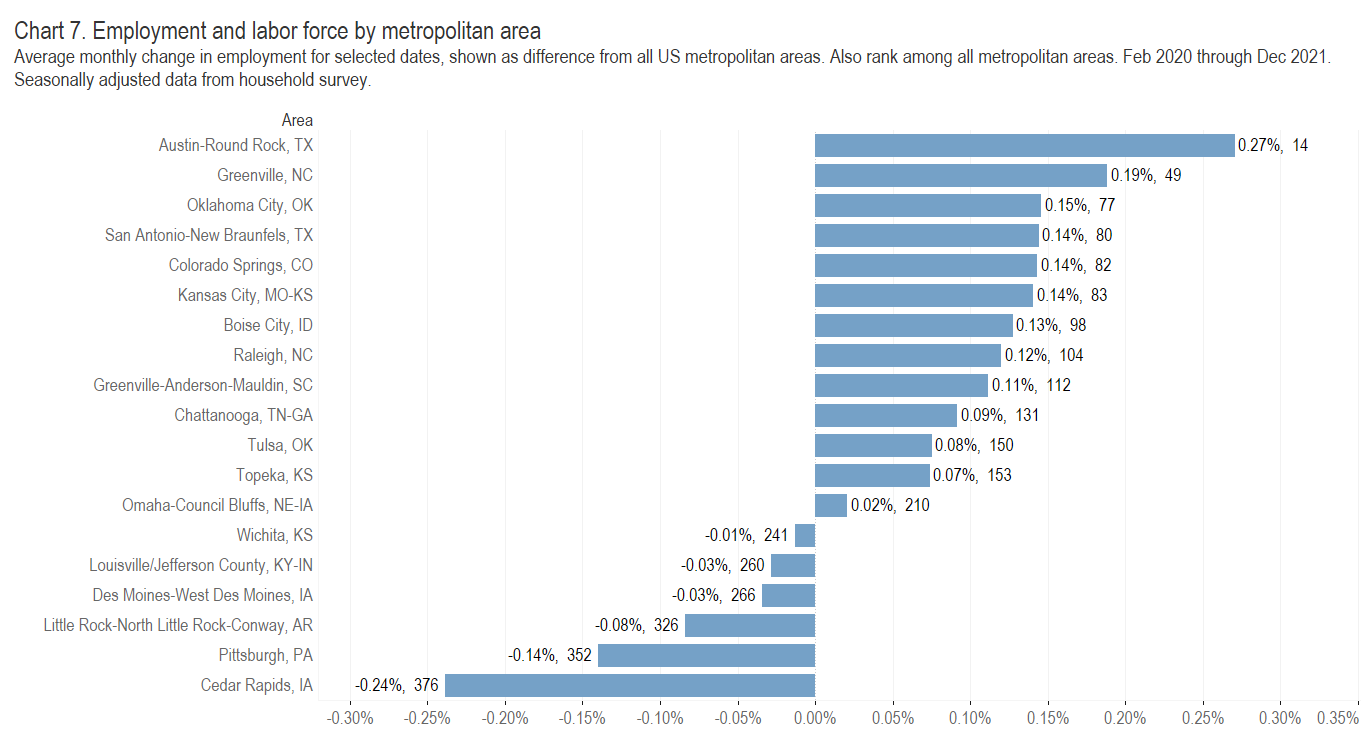
Wichita since the start of the pandemic
How has Wichita fared since the start of the pandemic compared to other metropolitan areas?
-
Kansas Tax Revenue, January 2022
For January 2022, Kansas tax revenue was 18.7 percent greater than January 2021 and up 6.1 percent from December 2021.
-

Migration trends in Kansas and the Nation
New U.S. Census Bureau data shows that Kansas continues to have low rates of domestic migration, with more people moving from Kansas than moving to the state.
-
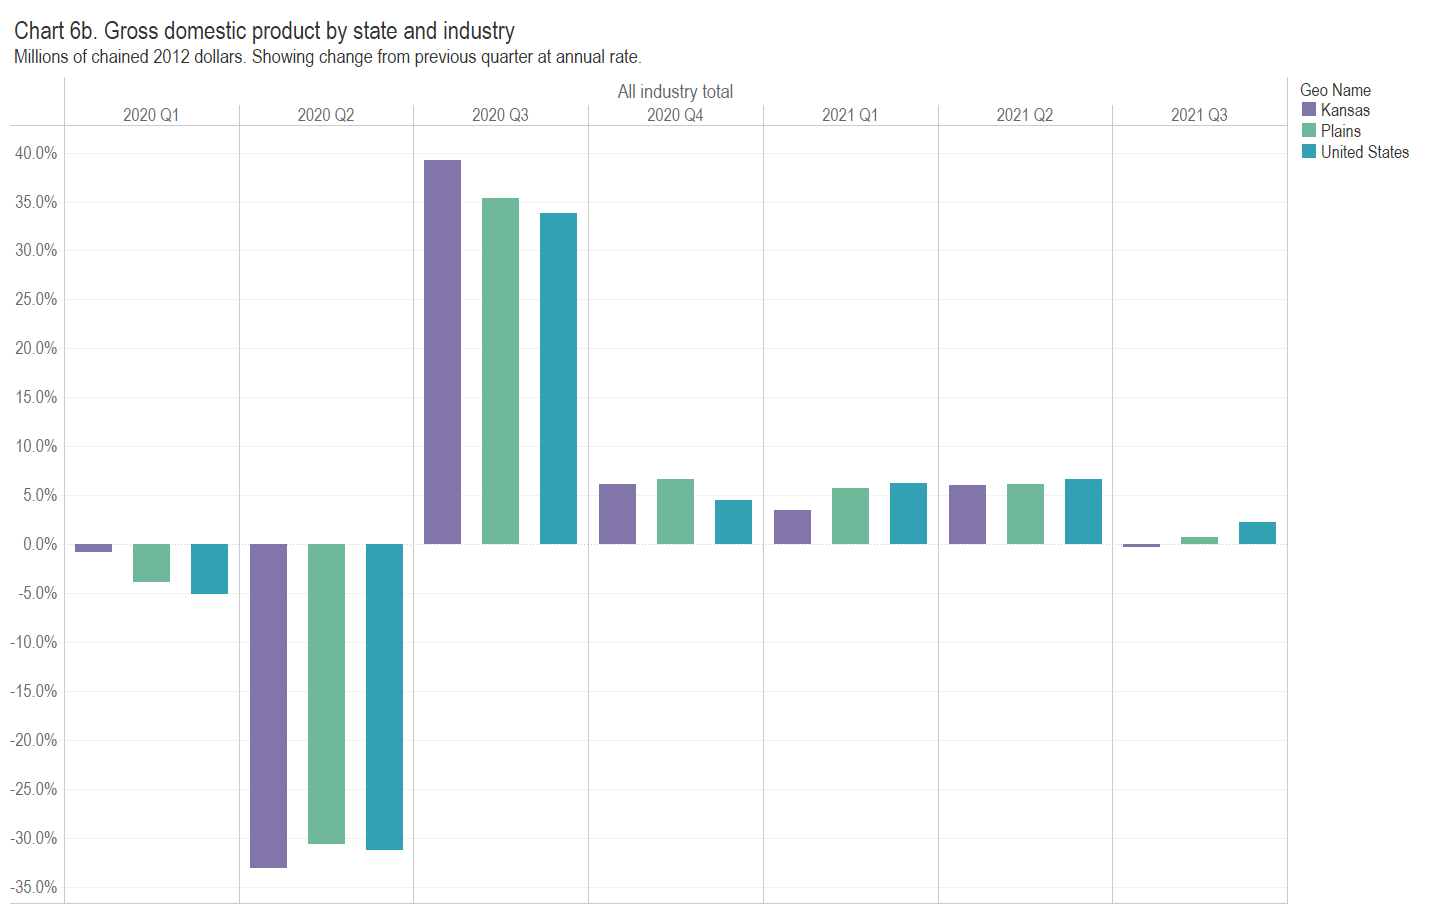
Kansas GDP, third quarter of 2021
In the third quarter of 2021, the Kansas economy contracted at the annual rate of 0.3 percent. Gross Domestic Product grew in 37 states, with Kansas ranking fortieth.