Tag: Visualizations
-
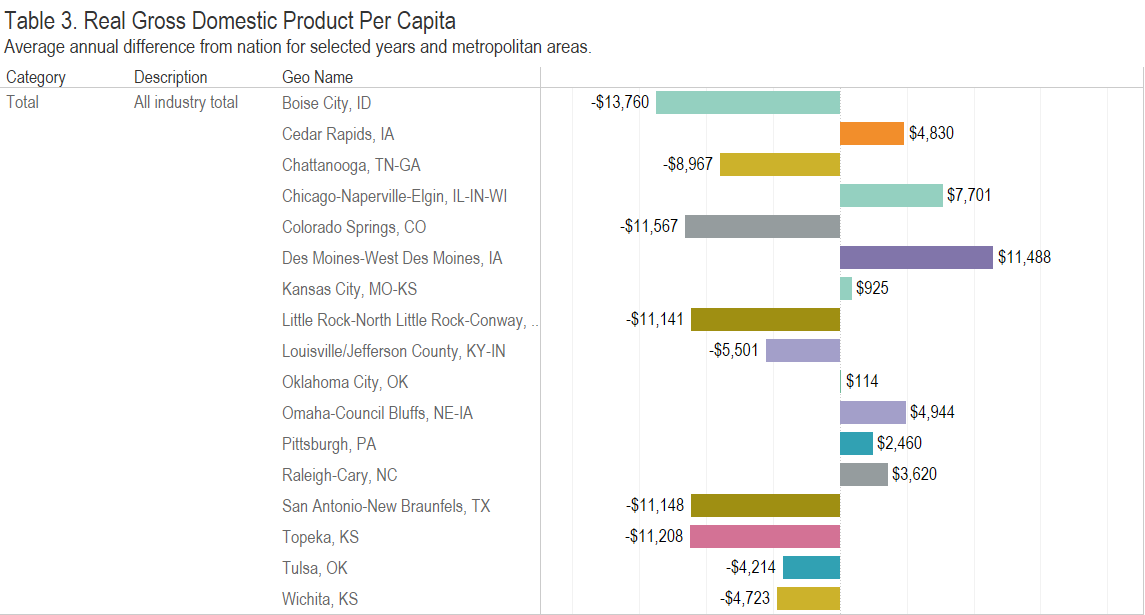
Gross Domestic Product in Metropolitan Areas
Examining the economy of metropolitan areas in an interactive visualization. Wichita examples included.
-
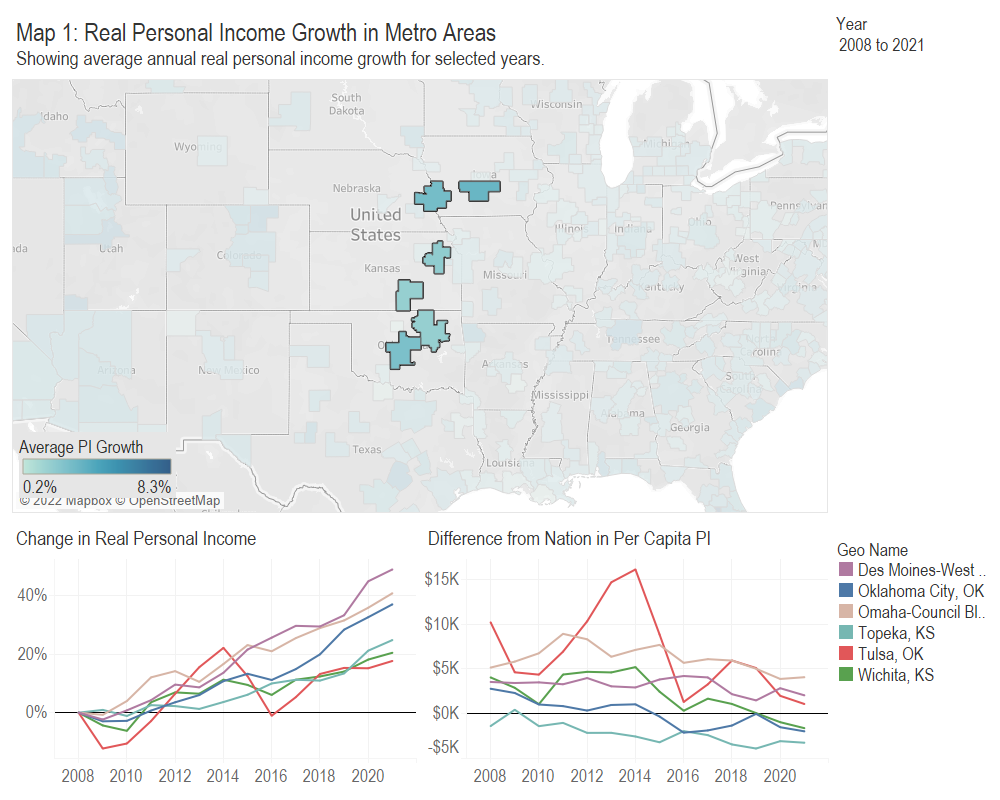
Real Personal Income for Wichita and other Metropolitan Areas
An interactive visualization of real personal income in metropolitan areas.
-

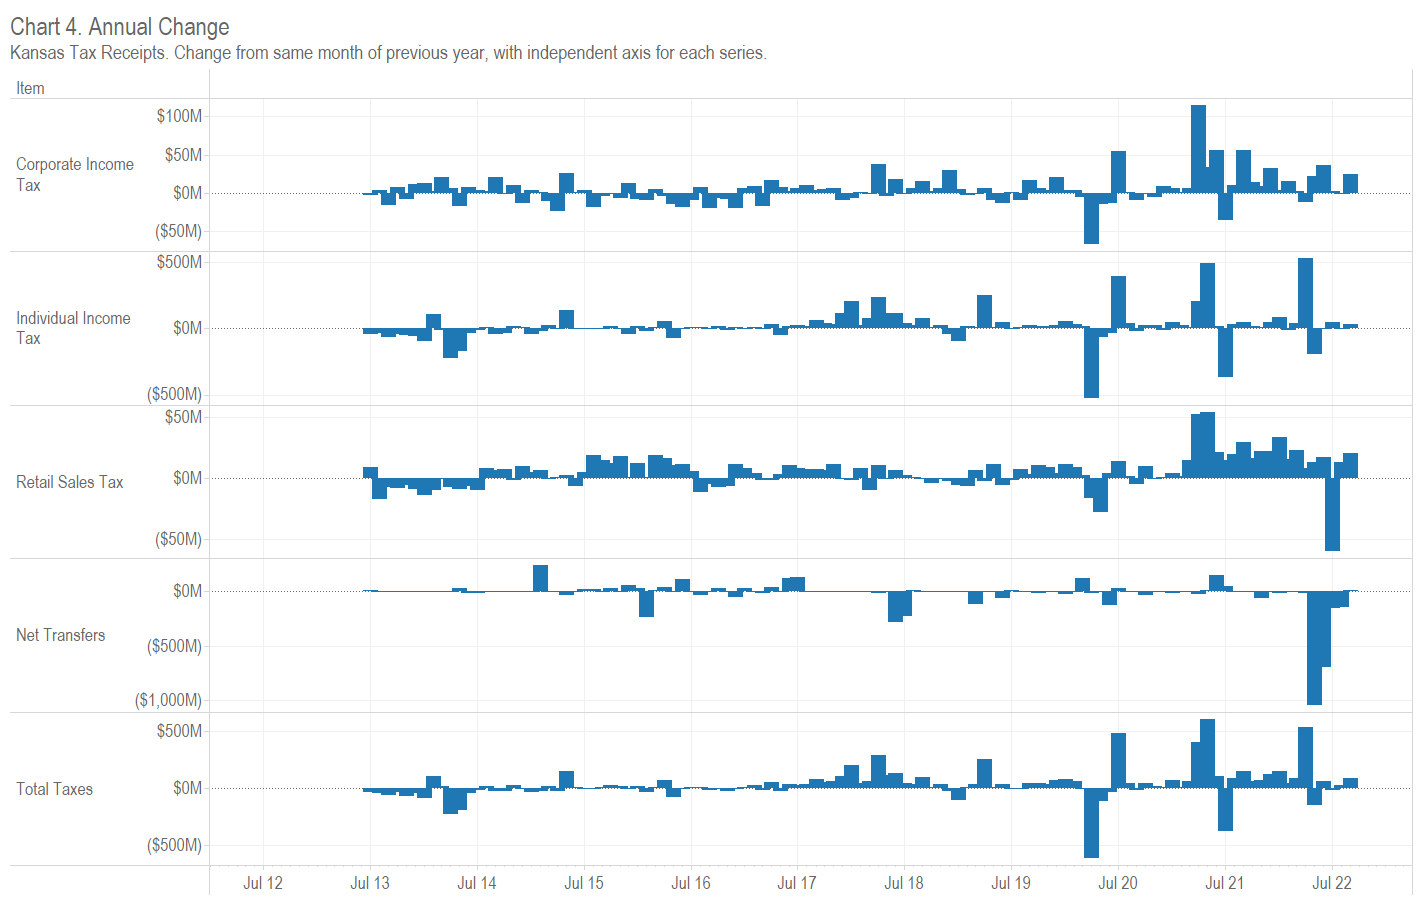
Kansas Tax Revenue, November 2022
For November 2022, Kansas tax revenue was 2.5 percent higher than November 2021. Collections for fiscal year 2023 after five months are 5.4 percent greater than the prior year.
-

Presidential Data Explorer Updated
Explore the economic record of presidents, starting with Harry S Truman. Updated with recent data.
-

Kansas Tax Revenue, October 2022
For October 2022, Kansas tax revenue was 11.7 percent higher than October 2021. Collections for fiscal year 2023 after four months are 6.1 percent greater than the prior year.
-

Presidential Data Explorer Updated
Explore the economic record of presidents, starting with Harry S Truman. Updated with recent data.
-
Kansas Tax Revenue, September 2022
For September 2022, Kansas tax revenue was 9.6 percent higher than September 2021. Collections for fiscal year 2023 are 4.4 percent greater than the prior year.
-
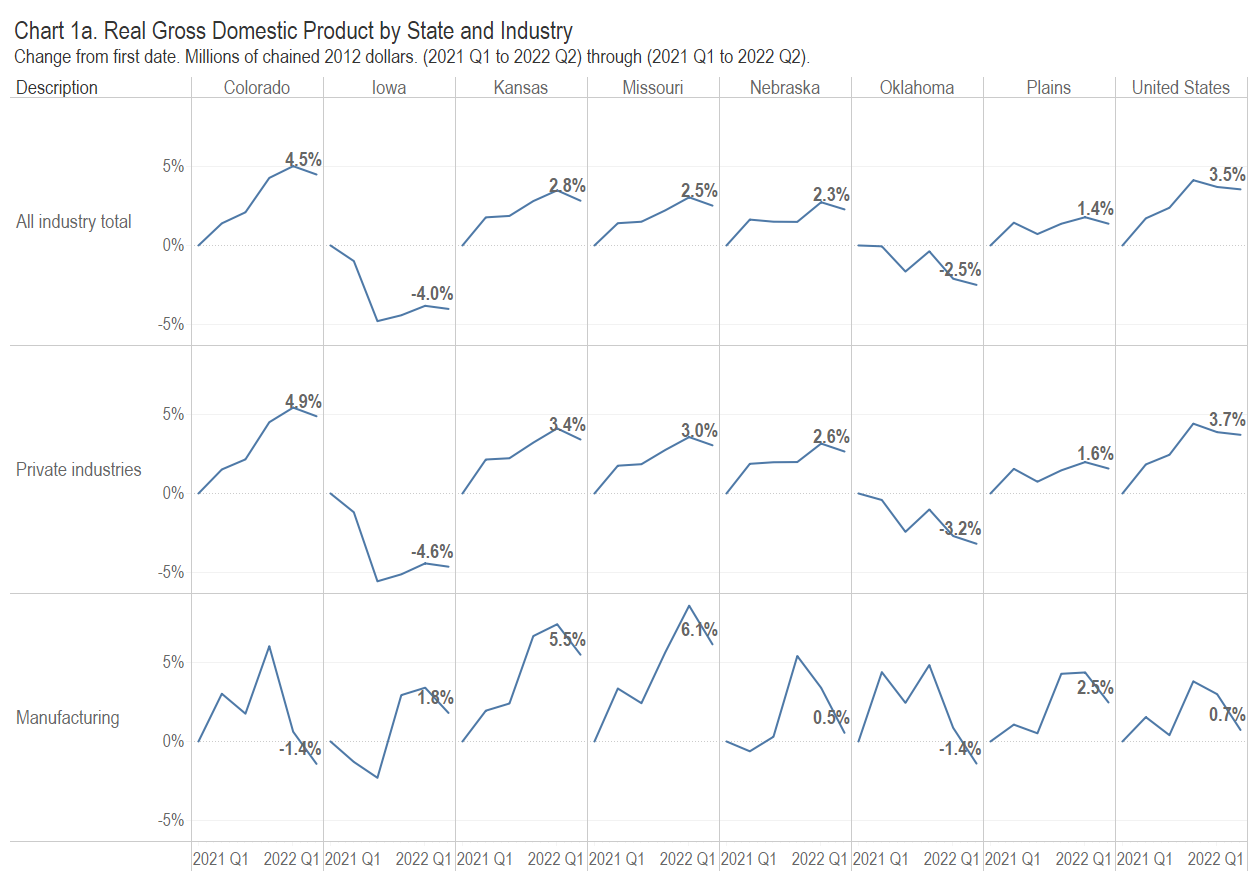
Kansas GDP, Second Quarter of 2022
In the second quarter of 2022, the Kansas economy contracted at the annual rate of 2.5 percent. Gross Domestic Product fell in 40 states, with Kansas ranking forty-third.
-
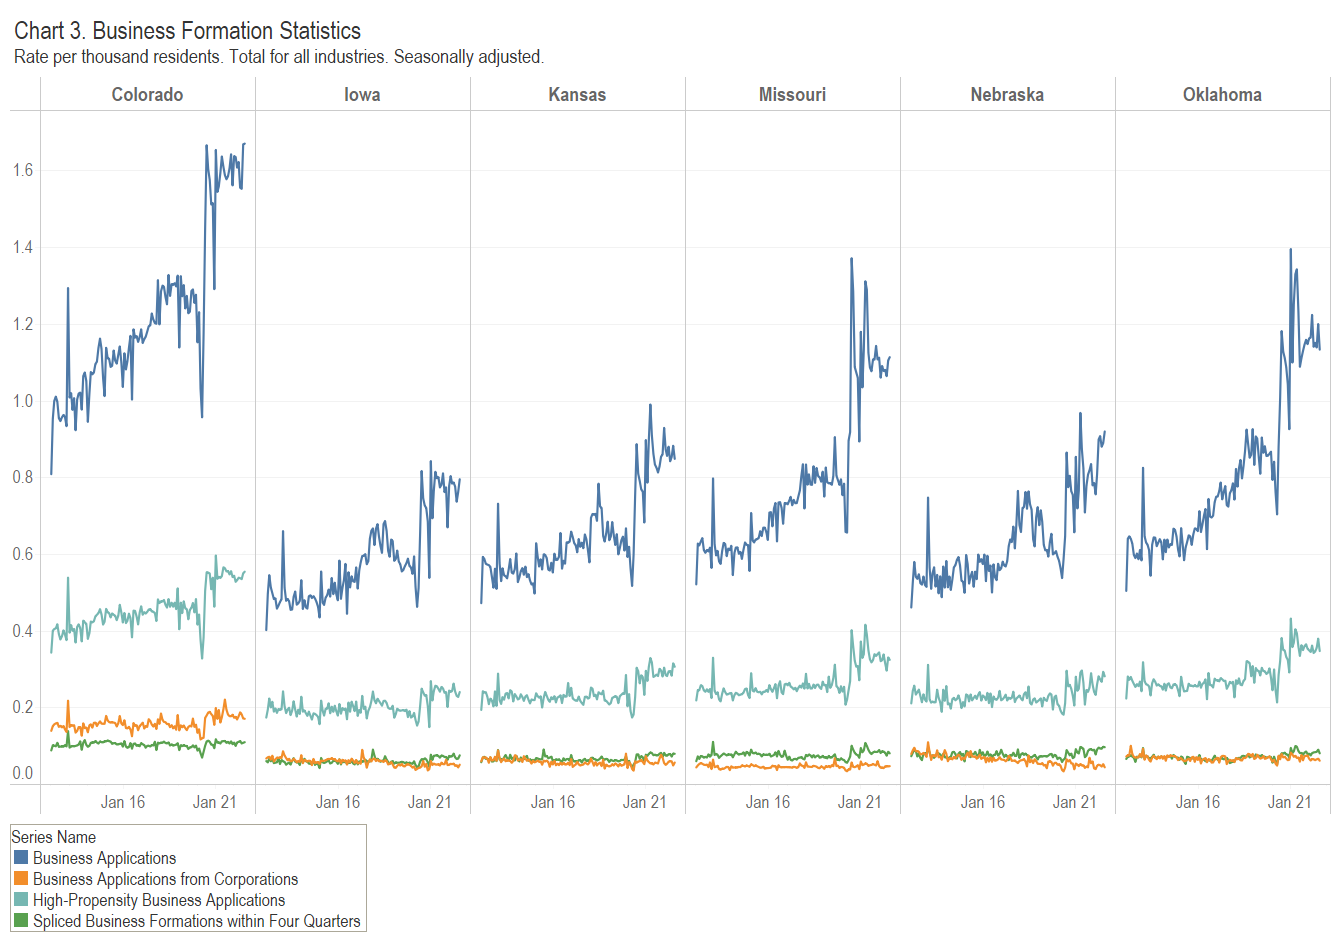
Business Formation in Kansas
For both business applications and business formations, Kansas does better than some states, but lags many states and the nation.
-

Presidential Data Explorer Updated
Explore the economic record of presidents, starting with Harry S Truman. Updated with recent data.
-

Kansas Tax Revenue, August 2022
For August 2022, Kansas tax revenue was 8.3 percent higher than August 2021. Collections for fiscal year 2023 are 0.6 percent greater than the prior year.
-
Kansas Tax Revenue, July 2022
For July 2022, Kansas tax revenue was 2.7 percent less than July 2021. There are special circumstances.